hexagon logo

Tabular data file

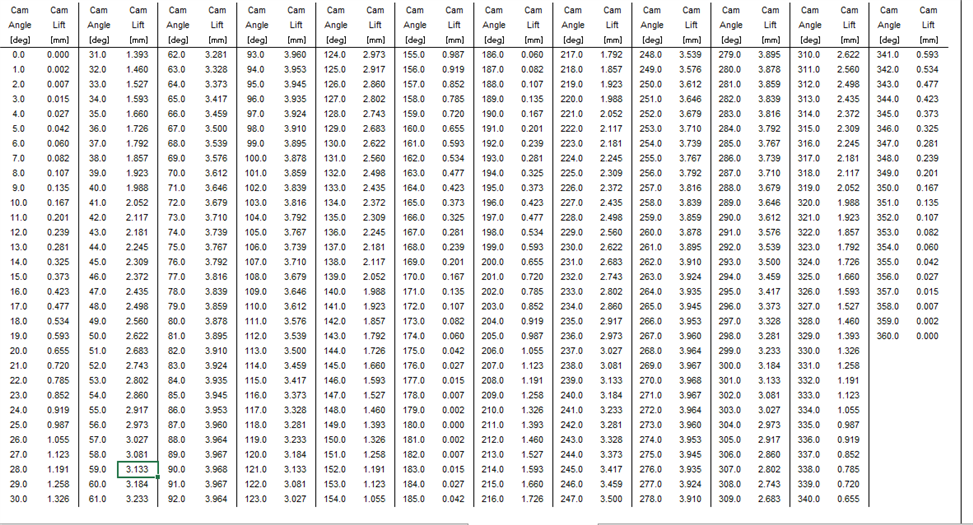
We have a cam lobe that our supplier measures in spec, but when we try to measure the same profile from what's supposedly a nominal cad model it's out of spec. We have a similar part that has the same issue that we sent to Hexagon and was measured using Quindos that was found in spec and the result correlated to the suppliers. The profile of lobe is defined by a tabular data file that looks like this:

 ​We're wondering how to import this data into the demon.
  • You just have to remember Excel works in radians for the IJK vectors.
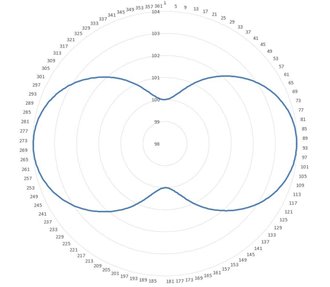
  • This is an idea of the profile (here r=100, but it's only an example)...
    Using directly sine ansd cosine of the angle for the vector should give a bad ball compensation...

    You have to search the right equation of the profile (look like an ellipse), the derivate it to find the vectors.
    You can also measure the same points with two different tip diameter, extract center ball (RAWHIT) and calculate the right vector.
    (If you can, post the real radius, it could help...)
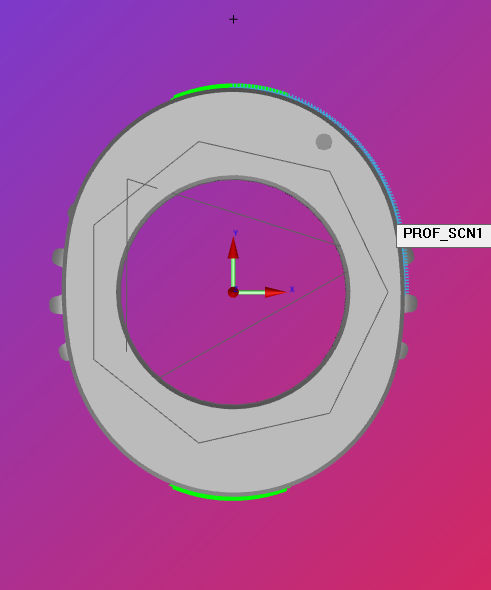
  • There is definitely something wrong. All the theocraticals look correct and I've verified the vectors of some of the points manually. In an offline simulation it works fine, when the machine tries to measure it, crash!
    I did notice when I pull my tabular data file in it changes vectors from 1,0,0 to 0,1,0 on the 1st point. The basic radius it 20.5.
    Version 2016


    OF_SCN1  =FEAT/SCAN,FREEFORM,NUMBER OF HITS=91,SHOW HITS=NO,SHOWALLPARAMS=NO
                MEAS/SCAN
                BASICSCAN/FREEFORM,NUMBER OF HITS=91,SHOW HITS=YES,SHOWALLPARAMS=NO
                HIT/VECTOR,<20.5,0,0>,<1,0,0>,<20.5,0,0>,T=0
                HIT/VECTOR,<20.4986,0.3578,0>,<0.9998477,0.0174524,0>,<20.4986,0.3578,0>,T=0
                HIT/VECTOR,<20.4942,0.7157,0>,<0.9993908,0.0348995,0>,<20.4942,0.7157,0>,T=0
                HIT/VECTOR,<20.4869,1.0737,0>,<0.9986295,0.052336,0>,<20.4869,1.0737,0>,T=0
                HIT/VECTOR,<20.4767,1.4319,0>,<0.9975641,0.0697565,0>,<20.4767,1.4319,0>,T=0
                HIT/VECTOR,<20.4636,1.7903,0>,<0.9961947,0.0871557,0>,<20.4636,1.7903,0>,T=0
                HIT/VECTOR,<20.4475,2.1491,0>,<0.9945219,0.1045285,0>,<20.4475,2.1491,0>,T=0
                HIT/VECTOR,<20.4283,2.5083,0>,<0.9925462,0.1218693,0>,<20.4283,2.5083,0>,T=0
                HIT/VECTOR,<20.4062,2.8679,0>,<0.9902681,0.1391731,0>,<20.4062,2.8679,0>,T=0
                HIT/VECTOR,<20.3809,3.228,0>,<0.9876883,0.1564345,0>,<20.3809,3.228,0>,T=0
                HIT/VECTOR,<20.3526,3.5887,0>,<0.9848078,0.1736482,0>,<20.3526,3.5887,0>,T=0
                HIT/VECTOR,<20.321,3.95,0>,<0.9816272,0.190809,0>,<20.321,3.95,0>,T=0
                HIT/VECTOR,<20.2862,4.312,0>,<0.9781476,0.2079117,0>,<20.2862,4.312,0>,T=0
                HIT/VECTOR,<20.2481,4.6747,0>,<0.9743701,0.2249511,0>,<20.2481,4.6747,0>,T=0
                HIT/VECTOR,<20.2066,5.0381,0>,<0.9702957,0.2419219,0>,<20.2066,5.0381,0>,T=0
                HIT/VECTOR,<20.1616,5.4023,0>,<0.9659258,0.258819,0>,<20.1616,5.4023,0>,T=0
                HIT/VECTOR,<20.1129,5.7673,0>,<0.9612617,0.2756374,0>,<20.1129,5.7673,0>,T=0
                HIT/VECTOR,<20.0606,6.1331,0>,<0.9563048,0.2923717,0>,<20.0606,6.1331,0>,T=0
                HIT/VECTOR,<20.0044,6.4998,0>,<0.9510565,0.309017,0>,<20.0044,6.4998,0>,T=0
                HIT/VECTOR,<19.9442,6.8673,0>,<0.9455186,0.3255682,0>,<19.9442,6.8673,0>,T=0
                HIT/VECTOR,<19.8797,7.2356,0>,<0.9396926,0.3420201,0>,<19.8797,7.2356,0>,T=0
                HIT/VECTOR,<19.8102,7.6044,0>,<0.9335804,0.358368,0>,<19.8102,7.6044,0>,T=0
                HIT/VECTOR,<19.7352,7.9736,0>,<0.9271839,0.3746066,0>,<19.7352,7.9736,0>,T=0
                HIT/VECTOR,<19.6545,8.3428,0>,<0.9205049,0.3907311,0>,<19.6545,8.3428,0>,T=0
                HIT/VECTOR,<19.5676,8.712,0>,<0.9135455,0.4067366,0>,<19.5676,8.712,0>,T=0
                HIT/VECTOR,<19.4741,9.0809,0>,<0.9063078,0.4226183,0>,<19.4741,9.0809,0>,T=0
                HIT/VECTOR,<19.3737,9.4492,0>,<0.898794,0.4383711,0>,<19.3737,9.4492,0>,T=0
                HIT/VECTOR,<19.2663,9.8167,0>,<0.8910065,0.4539905,0>,<19.2663,9.8167,0>,T=0
                HIT/VECTOR,<19.1519,10.1832,0>,<0.8829476,0.4694716,0>,<19.1519,10.1832,0>,T=0
                HIT/VECTOR,<19.0303,10.5487,0>,<0.8746197,0.4848096,0>,<19.0303,10.5487,0>,T=0
                HIT/VECTOR,<18.9017,10.9129,0>,<0.8660254,0.5,0>,<18.9017,10.9129,0>,T=0
                HIT/VECTOR,<18.766,11.2757,0>,<0.8571673,0.5150381,0>,<18.766,11.2757,0>,T=0
                HIT/VECTOR,<18.6231,11.637,0>,<0.8480481,0.5299193,0>,<18.6231,11.637,0>,T=0
                HIT/VECTOR,<18.4732,11.9966,0>,<0.8386706,0.544639,0>,<18.4732,11.9966,0>,T=0
                HIT/VECTOR,<18.3162,12.3544,0>,<0.8290376,0.5591929,0>,<18.3162,12.3544,0>,T=0
                HIT/VECTOR,<18.1521,12.7103,0>,<0.819152,0.5735764,0>,<18.1521,12.7103,0>,T=0
                HIT/VECTOR,<17.981,13.064,0>,<0.809017,0.5877853,0>,<17.981,13.064,0>,T=0
                HIT/VECTOR,<17.8029,13.4154,0>,<0.7986355,0.601815,0>,<17.8029,13.4154,0>,T=0
                HIT/VECTOR,<17.6177,13.7645,0>,<0.7880108,0.6156615,0>,<17.6177,13.7645,0>,T=0
                HIT/VECTOR,<17.4256,14.111,0>,<0.777146,0.6293204,0>,<17.4256,14.111,0>,T=0
                HIT/VECTOR,<17.2265,14.4548,0>,<0.7660444,0.6427876,0>,<17.2265,14.4548,0>,T=0
                HIT/VECTOR,<17.0206,14.7957,0>,<0.7547096,0.656059,0>,<17.0206,14.7957,0>,T=0
                HIT/VECTOR,<16.8077,15.1337,0>,<0.7431448,0.6691306,0>,<16.8077,15.1337,0>,T=0
                HIT/VECTOR,<16.588,15.4685,0>,<0.7313537,0.6819984,0>,<16.588,15.4685,0>,T=0
                HIT/VECTOR,<16.3615,15.8001,0>,<0.7193398,0.6946584,0>,<16.3615,15.8001,0>,T=0
                HIT/VECTOR,<16.1282,16.1282,0>,<0.7071068,0.7071068,0>,<16.1282,16.1282,0>,T=0
                HIT/VECTOR,<15.8883,16.4528,0>,<0.6946584,0.7193398,0>,<15.8883,16.4528,0>,T=0
                HIT/VECTOR,<15.6417,16.7737,0>,<0.6819984,0.7313537,0>,<15.6417,16.7737,0>,T=0
                HIT/VECTOR,<15.3885,17.0907,0>,<0.6691306,0.7431448,0>,<15.3885,17.0907,0>,T=0
                HIT/VECTOR,<15.1287,17.4036,0>,<0.656059,0.7547096,0>,<15.1287,17.4036,0>,T=0
                HIT/VECTOR,<14.8623,17.7122,0>,<0.6427876,0.7660444,0>,<14.8623,17.7122,0>,T=0
                HIT/VECTOR,<14.5893,18.0162,0>,<0.6293204,0.777146,0>,<14.5893,18.0162,0>,T=0
                HIT/VECTOR,<14.3096,18.3155,0>,<0.6156615,0.7880108,0>,<14.3096,18.3155,0>,T=0
                HIT/VECTOR,<14.0234,18.6097,0>,<0.601815,0.7986355,0>,<14.0234,18.6097,0>,T=0
                HIT/VECTOR,<13.7306,18.8986,0>,<0.5877853,0.809017,0>,<13.7306,18.8986,0>,T=0
                HIT/VECTOR,<13.4314,19.182,0>,<0.5735764,0.819152,0>,<13.4314,19.182,0>,T=0
                HIT/VECTOR,<13.1258,19.4597,0>,<0.5591929,0.8290376,0>,<13.1258,19.4597,0>,T=0
                HIT/VECTOR,<12.8139,19.7317,0>,<0.544639,0.8386706,0>,<12.8139,19.7317,0>,T=0
                HIT/VECTOR,<12.4959,19.9976,0>,<0.5299193,0.8480481,0>,<12.4959,19.9976,0>,T=0
                HIT/VECTOR,<12.1718,20.2573,0>,<0.5150381,0.8571673,0>,<12.1718,20.2573,0>,T=0
                HIT/VECTOR,<11.8418,20.5106,0>,<0.5,0.8660254,0>,<11.8418,20.5106,0>,T=0
                HIT/VECTOR,<11.506,20.7574,0>,<0.4848096,0.8746197,0>,<11.506,20.7574,0>,T=0
                HIT/VECTOR,<11.1646,20.9975,0>,<0.4694716,0.8829476,0>,<11.1646,20.9975,0>,T=0
                HIT/VECTOR,<10.8176,21.2308,0>,<0.4539905,0.8910065,0>,<10.8176,21.2308,0>,T=0
                HIT/VECTOR,<10.4653,21.457,0>,<0.4383711,0.898794,0>,<10.4653,21.457,0>,T=0
                HIT/VECTOR,<10.1077,21.676,0>,<0.4226183,0.9063078,0>,<10.1077,21.676,0>,T=0
                HIT/VECTOR,<9.745,21.8876,0>,<0.4067366,0.9135455,0>,<9.745,21.8876,0>,T=0
                HIT/VECTOR,<9.3774,22.0918,0>,<0.3907311,0.9205049,0>,<9.3774,22.0918,0>,T=0
                HIT/VECTOR,<9.0051,22.2883,0>,<0.3746066,0.9271839,0>,<9.0051,22.2883,0>,T=0
                HIT/VECTOR,<8.6281,22.477,0>,<0.358368,0.9335804,0>,<8.6281,22.477,0>,T=0
                HIT/VECTOR,<8.2468,22.6579,0>,<0.3420201,0.9396926,0>,<8.2468,22.6579,0>,T=0
                HIT/VECTOR,<7.8613,22.8308,0>,<0.3255682,0.9455186,0>,<7.8613,22.8308,0>,T=0
                HIT/VECTOR,<7.4717,22.9955,0>,<0.309017,0.9510565,0>,<7.4717,22.9955,0>,T=0
                HIT/VECTOR,<7.0783,23.152,0>,<0.2923717,0.9563048,0>,<7.0783,23.152,0>,T=0
                HIT/VECTOR,<6.6812,23.3001,0>,<0.2756374,0.9612617,0>,<6.6812,23.3001,0>,T=0
                HIT/VECTOR,<6.2807,23.4397,0>,<0.258819,0.9659258,0>,<6.2807,23.4397,0>,T=0
                HIT/VECTOR,<5.8769,23.5708,0>,<0.2419219,0.9702957,0>,<5.8769,23.5708,0>,T=0
                HIT/VECTOR,<5.47,23.6932,0>,<0.2249511,0.9743701,0>,<5.47,23.6932,0>,T=0
                HIT/VECTOR,<5.0603,23.8069,0>,<0.2079117,0.9781476,0>,<5.0603,23.8069,0>,T=0
                HIT/VECTOR,<4.648,23.9117,0>,<0.190809,0.9816272,0>,<4.648,23.9117,0>,T=0
                HIT/VECTOR,<4.2332,24.0077,0>,<0.1736482,0.9848078,0>,<4.2332,24.0077,0>,T=0
                HIT/VECTOR,<3.8162,24.0947,0>,<0.1564345,0.9876883,0>,<3.8162,24.0947,0>,T=0
                HIT/VECTOR,<3.3973,24.1727,0>,<0.1391731,0.9902681,0>,<3.3973,24.1727,0>,T=0
                HIT/VECTOR,<2.9765,24.2416,0>,<0.1218693,0.9925462,0>,<2.9765,24.2416,0>,T=0
                HIT/VECTOR,<2.5542,24.3015,0>,<0.1045285,0.9945219,0>,<2.5542,24.3015,0>,T=0
                HIT/VECTOR,<2.1305,24.3522,0>,<0.0871557,0.9961947,0>,<2.1305,24.3522,0>,T=0
                HIT/VECTOR,<1.7058,24.3937,0>,<0.0697565,0.9975641,0>,<1.7058,24.3937,0>,T=0
                HIT/VECTOR,<1.2801,24.426,0>,<0.052336,0.9986295,0>,<1.2801,24.426,0>,T=0
                HIT/VECTOR,<0.8538,24.4492,0>,<0.0348995,0.9993908,0>,<0.8538,24.4492,0>,T=0
                HIT/VECTOR,<0.427,24.463,0>,<0.0174524,0.9998477,0>,<0.427,24.463,0>,T=0
                HIT/VECTOR,<0,24.4677,0>,<0,1,0>,<0,24.4677,0>,T=0
                ENDSCAN
                ENDMEAS/​
  • I added a probe radius to my tabular data, and it runs, but shows no deviation. Mirrored the scan in X with the same results.
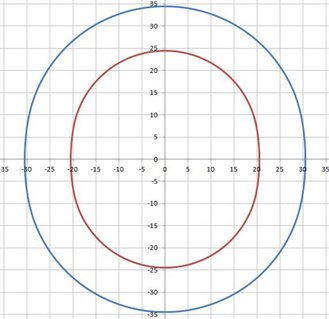
  • Assuming profile is not to far from y=(24.468/20.5)*sqrt(20.5^2-x^2)+sqrt(2)*(sin(2*angle))^2 (ok, I know, the error max on Y is about 0.6 mmm !), it allows calculating the derivate, so a normal vector... (in the text file, from 0 to 90, then mirror twice).
    Maybe measuring once with surface vectors would be more accurate... (then save in a text file and create the scan)...
    points 0 _ 90.txt
  • not sure it can be usefull, the max lift is (63)^2/1000...
    If someone can use it ...?
  • Another way seems to work, calculate the curvature from 3 consecutive hits, and then calculate the vector from the center to the 2nd hit (middle of the arc, so gives the normal vector.)
    The graph shows the points and the points + 10*vector normal.


    points 0-360.txt
  • One thing to think about: in the data it says "lift". That would indicate a measuring device like a dial gauge that is always perpendicular to the rotation center of the part. So, no need to calculate vectors, cause the vector will always be something like 0, 0, 1. On such a small part, calculating a compensation vector perpendicular to the profile might give a wrong impression of the true deviations.