hexagon logo

Understanding Profile of A Line Report

Looking for clarification on how PC-DMIS reports the profile of a line values.

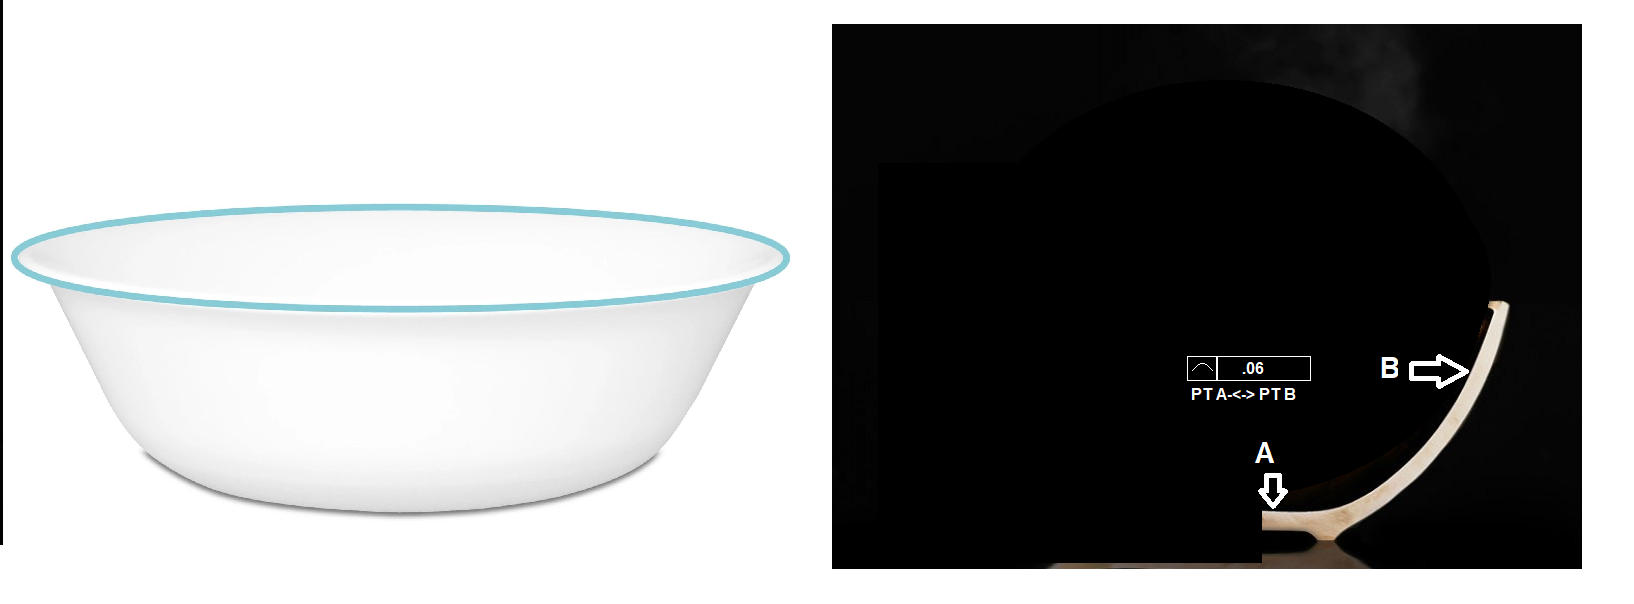
The part in question is a cylindrically symmetrical curve, with a cross section cutout listed as a profile of a line between point A<->point B. No datum structure on the control frame. Profile limit .060"

When getting a report trying to get a best-fit result, I usually expect the min and max values to be similar, and according to the online help https://docs.hexagonmi.com/pcdmis/2020.2/en/helpcenter/mergedProjects/core/geometric_tolerances/Profile_of_a_Line.htm
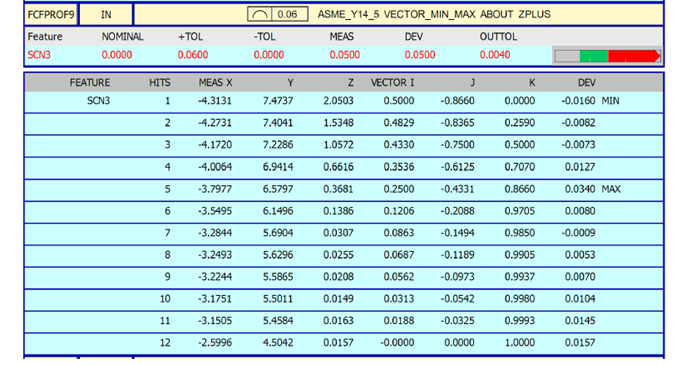
Setting min/max should find the smallest tolerance to fit all the points, but it shows -.016" to +.034" range.

The initial line of the report shows that it is only using .050" of the .060" tolerance but also is out of tolerance, not helping my confusion.

Taking the actual points reported and running them with the other softwares we have at our facility, I have more experience in and can get the even split of the deviations (-.023"<->+.019") or an overall lower profile (-.013"<->+.025") with another

So is there a simple answer to the following questions
1) is the profile good at the initial .050" reporting, even though it is listing it .004" over?
2) Is there a obvious reason that the min max in not having all the point inside the tolerance window.


  • This isn't how it is done anymore, however, it was in your version interpreted (at least by Hexagon) that Y14.5 profile was to be reported as the amount of delta between high and low (in your case .050) AND reported with a locational component to that range, in your case shifted sideways a bit.

    So, you have a .060 range, that is +/- .030 from nominal.
    Your high is + .034.
    You low is -.016.
    .034 is out of print by .004.
    The delta between .034 and -.016 is .050.

    If you were using GeoTol, this would be reported as .068 instead of .050, and still show as .004 out of print to that one point. (GeoTol might say .008 out of print, but the reality is, your part is .004 out of print at that one point and it is plus material (presuming you have the in/out defined so PcDmis can tell), sand it and it will be in print).

    The math is REALLY stupidly confusing in Y14.5.1 for this, instead of saying worst error from nominal times two like normal human beings, it is (this math works IDENTICAL) the difference from the high limit to the worst reading, doubled and removed from the tolerance zone (tough to write in english). For this example, you are .004 from the limit, and you are out, so it is a negative .004. Muliply by two gives you negative .008. Subtract that from the tolerance of .060, but you are subtracting a negative, which equates to addition, .060 - -.008 = .068.
    I think I wrote that accurately.

    If you take the worst reading and muliply that delta from nominal by two, you get the same answer with a LOT less headache. Worst is .034, times two, gives .068. That is with the 2019 Y14.5.1 which explicitly controls the 2009 Y14.5 standard.

    Do it, even with your older version of PcDmis, in ISO instead of ASME, you'll get .068 as well, and they even define it with the sensible easy math... at least that's my understanding, I don't do ISO.

    Regardless of the math and reporting, your max hit is .034 and you are allowed +/- .030, so you have a problem with the area around hit 5.
  • The growth parameter g used in the actual value definition for profile of a surface allows for the tolerance to expand or contract in an attempt to locate the largest deviation. The "deviation times two" is encoded in the definition when the growth parameter is multiplied by two. A definition of "take the worst reading and multiply that delta from nominal by two" isn't robust, mathematically speaking, and involves some level of personal interaction. The new definition takes the personal interaction out and offers a standard algorithmic approach to determining the measured value.
  • Appreciate the break down on ISO/ASME reporting!

    Regardless of the math and reporting, your max hit is .034 and you are allowed +/- .030, so you have a problem with the area around hit 5.

    The part I'm struggling with to understand is why is the software not able to adjust to tolerance zone by .004" to -.020+.030 range as there is no datum structure being applied. As I read and understand the max min setting it was to place all the points in the smallest best fit zone, which I thought was the original .050" output, until the breakdown shows otherwise.


  • This depends on the shape of the feature in question. For example, if you have a cylinder of Ø.250 with a profile of .050, and it measures Ø.290, your profile would be .040 and the max and min would both be +.020 (if the form was perfect)
  • Because as a cylinder, any adjustments in one direction results in the same amount of movement in the opposite direction on the other side of the cylinder.
  • I think the term cylinder was misleading, the area that is called out for profile is just mirrored around the cylinder, the size of the cylinder is not tied to the profile control. Cereal bowl for a similar idea of the size of the bowl (while being tolerance'd else where) has no impact on the form of the profile callout, as long as the flow of "milk" from B<->A is the right slope.

    In the results being discussed, it says there is a lump outside that form, at pt5. however its should pt 1 (B) being at -.016 of its allowed -.030", if the tolerance zone was shifted (since there is no datum to control in nominal location) it should bring that max point ,.034" ,down at the cost of increasing the deviation on the min point. Other software's when I have used them would do that as part of the best fit option. The total spread might not decrease, depending on how that tolerance zone moves, but the part would be in tolerance.


  • So to be clear; the profile callout applies to just one side of the "bowl".
  • Each individual line measured for the profile of a line would apply to that one side, yes.
  • It could be that the result you're getting is in fact after the software has done its best to fit the tolerance zone. One way to check is to restrain the profile with datums. The results should be worse.
  • It is doing some besfitting compared to LSQ, but still seems very heavily weighted towards one side. 3-4 points are on the min, worst being -.016" (avg -.008"), and 8 being on the max side up to .034" (avg +13")