Is this a software bug or is there a setting that can be changed so that they appear in red when it is either the maximum or minimum of a dimension OOT?
Have you tried increasing the decimal places displayed? Put the following command in your code BEFORE the dimension in question
DISPLAYPRECISION/6
This will make the software show 6 decimal places for everything after this line of code. What it sounds like to me is you are not showing enough decimal places and what you are seeing is rounding error.
As an example, say you have a feature requirement of Ø.5000 ±.0010 and you are only displaying 4 decimal places, and say that the measured value is .49995. With only 4 decimals displayed, this will show up as .5000 on your report (because .49995 will round up to .5000 when displayed as 4 decimal places) and the color of the dimension will show it as in tolerance because .49995 <=.50000. Now, say the part measures .50004, this will also display as .5000 on the report due to rounding, but now the dimension will be red because the measured value is .00004 over the high limit.
Perhaps I didn´t explain my concern properly, in this example is a distance between two planes, MAX is OOT by .0001" but MEAS is in tolerance. I´ve noticed same issue with diameters. Workaround is using assignments to report MAX and MIN individually.
I think I get what you are saying. You want a visual indicator that the max or min value is out of tolerance even if the measured value is in tolerance.
I don't know of a setting for that. It would be nice if there were an option to make the text blue or something so you can glance at a report and know that there is a potential issue like that. I looked over the help files as best I could, but didn't find any settings for what you want. I even looked into ways to edit the label/report templates to maybe change the display behavior, but it doesn't look like an easy task - not that I'm all that skilled at messing with those, so maybe it is easier than I think.
My first thought would be the workaround that you already use. Reporting the Max and Min values individually. I'm sure that is a pain to do, but it has the advantage of giving you separate report items if you do any sort of SPC database stuff or process improvement studies. It will give you more data points to consider.
Something you may also consider is to make a basic script that you can run at the end of a measuring routine that would go through all the report features in the measuring routine and list any that are have max/min values that are out of spec. It would be tricky to add that information to the report, but you could at least have a text box open up with a notice to look closer at some features. Just a thought - maybe it could lead to better thoughts.
How are you currently using assignments to report he max/min values? I have a vague idea of how I would do it, but since you have already done the work, please share.
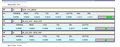
Sure, this is how I use assignments, but is a PITA to do for dozens of internal and external turned features (at least not required by customer for drilled holes):
Sure, this is how I use assignments, but is a PITA to do for dozens of internal and external turned features (at least not required by customer for drilled holes):
That does look like a PITA. I can't think of a way to make it much easier.
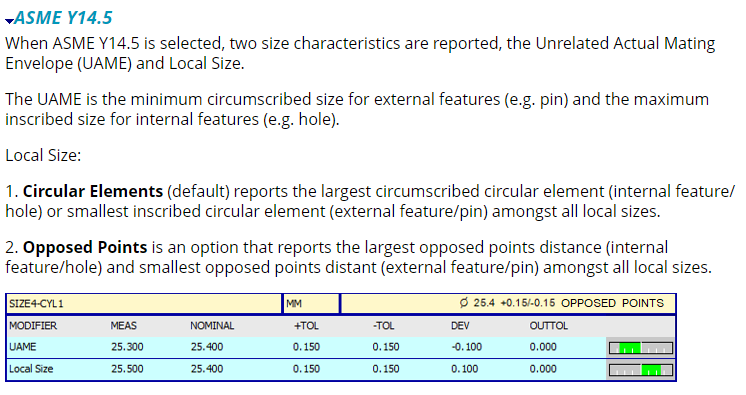
Another thought is that you might consider using a size dimension in addition to a location dimension. If you do that, the location dimension would be the reported diameter using whatever fit method you selected when the feature was measured (ex: Leas Squares). The size dimension (assuming you are using ASME standard) will give you the max diameter and minimum diameters. Here is an excerpt from the help file:
What you will find is that the max diameter and min diameter aren't exactly the same as would be reported in a location dimension. A hole for example will have the maximum diameter (UAME) reported as a maximum inscribed diameter and the minimum diameter (Local Size) will be either the largest circumscribed diameter or the largest opposed points diameter (largest diameter you would find if you measure with a 2 point gage like a caliper). Personally, I think this is better then using the max and min values from a location dimension, but it can be confusing for some people reading the report if the max value is out of tolerance in the location dimension but barely in tolerance when using the Local Size reporting options. You can avoid that confusion by omitting the MAX and MIN columns from the report.
If you prefer to stick to legacy reporting. You can achieve basically the same thing by constructing a maximum inscribed circle and Minimum circumscribed circle from all the points in a measured circle and report those circle diameters separately. This is still no easier that what you are already doing, but it is something to consider. If nothing else, maybe my mentioning it will help someone else with whatever difficult requirements their customers have.
Chris C is right, Distance is old school legacy. If the distance is a feature of size, (either a width or opposing faces) you can use the size command.
Doesn't help you though if it's a step height i.e. both faces have the same vector.
In that case you could do it in the reporting template.
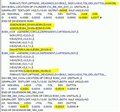
The report templates use the TOL function to test if the out of tol value is greater or less than zero, and if so it colours the dimension the error colour (usually red).
From the help of the TOL function
*TOL(<expression1>, <expression2>, <expression3>, <expression4> expression1 is the string to color, expression2 is the test value, expression3 is the maximum in-tolerance value, and expression4 is the minimum in-tolerance value. If the test value is in tolerance (between the values for expression3 and expression4), then the software colors the text black. Otherwise, the software colors the text with the error color (usually red). You can define the error color in the Color Editor dialog box (Edit | Preferences | Edit Window Colors). For example, this code displays the text "In Tolerance" in black: =TOL("In Tolerance",100,100.5,99.5) This code displays the text "Out of Tolerance" in the error color (by default, this is red): =TOL("Out of Tolerance",99,100.5,99.5)
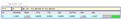
This is how it looks in the Max cell of the Legacy Dimension Label (used for distance)