hexagon logo

Spline with formula behind

Hello everyone,
 
 
My model, developed with ADAMS View, has a marker called "Origin" with coordinates {0.0, 0.0, 0.0} and a second marker called "Relative".
 
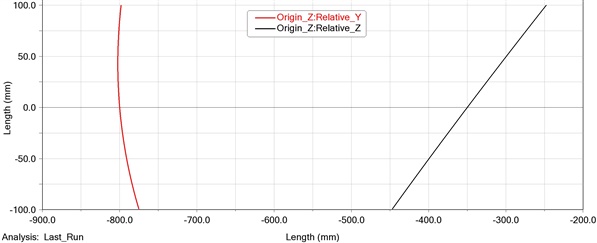
I am using 2 measurements in order to plot the displacement of Relative on Y direction, but related to the Origin.
Also the displacement of Relative on Z direction, but related to the same Origin.
 
Both 2D splines have approx. 2000 points on each column.
 
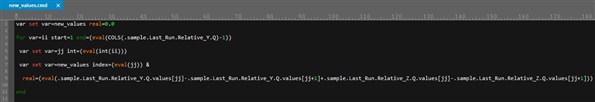
I want to generate a 3rd spline by using the data from previous measurements.
This new spline will have a formula behind :
 
 
Relative.Y (1st point) - Relative.Y (2nd point) + Relative.Z (1st point) - Relative.Z (2nd point)
 
then,
 
Relative.Y (2nd point) - Relative.Y (3rd point) + Relative.Z (2nd point) - Relative.Z (3rd point)
 
then,
 
Relative.Y (3rd point) - Relative.Y (4thd point) + Relative.Z (3rd point) - Relative.Z (4thd point)
 
and so on until
 
Relative.Y (1999th point) - Relative.Y (2000th point) + Relative.Z (1999th point) - Relative.Z (2000th point)
 
 
In Excel I could do that very easy, but now I want to generate this in ADAMS either.
 
I would prefer to have a simple equation, instead of 2000 equations Joy ... I do not know... something with while loop... I guess....
 
Can you please give me some recommendations how to write this formula ?
 
Many thanks! Regards,
Daniel
  • Why do you want to do this inside Adams? This is a post/pre-processing step, right?
    So do this in Excel, save the resulting data in a csv file and import into View as a spline.
     
    If you want to do it in Adams, it is not hard to do in pre/post processing step. Easiest and fastest is to switch to Python, but can be done in cmd as well.
     
    Here is the syntax for a loop in cmd.
    for var=ii start=1 end=1999
    var set var=jj int=(eval(int(ii))) !! the loop variable is a real and you want to index using integers
    .
    .
    .
    end
     
     
    If you want to do it during run-time, it is much more complicated. A subroutine is recommended for that.
  • Hello @Jesper Slattengren​ ,
     
    Indeed, this is a part of post-processing and also belongs to an optimization procedure.
     
    Depending on how the 3rd spline does look like, I will adjust the location of marker "Relative" in order to get the best version of the 3rd spline.
     
    I have tried to use your hint / syntax, but unfortunately it does not work :(
     
     
    Regards,
    Daniel
  • Can you post your model and your code?
    You say that the data is stored in splines? How do you try to access the values from the splines? The correct syntax would be .model_1.Spline_1.ys[jj]
     
  • Hey @Jesper Slattengren​ ,
     
    Please find attached the "sample.cmd".
     
    Here you will see 3 measurements (Origin_Z , Relative_Y and Relative_Z).
    After running the model with the following setup : End Time = 2.0 and Steps = 2000, you can plot the displacement of Relative_Y based on Origin_Z and Relative_Z based on Origin_Z (see the picture attached).
     
    Can you please try your solution and give me afterwards the new .cmd ?
     
    Many thanks for your time! Regards,
    Daniel


    Splines

    Attached Files (1)
  • You can't create this inside the model. It has to be a macro or command file that you execute (read in) after the analysis is done. This code creates a new view variables with all the values you are asking for.
     
    var set var=new_values real=0.0
    for var=ii start=1 end=(eval(COLS(.sample.Last_Run.Relative_Y.Q)-1))
     var set var=jj int=(eval(int(ii)))
     var set var=new_values index=(eval(jj)) &
      real=(eval(.sample.Last_Run.Relative_Y.Q.values[jj]-.sample.Last_Run.Relative_Y.Q.values[jj+1]+.sample.Last_Run.Relative_Z.Q.values[jj]-.sample.Last_Run.Relative_Z.Q.values[jj+1]))
    end
     
    Copy this to a file "new_values.cmd". After you run the simulation, press F2 and read in this file.
  • Hey @Jesper Slattengren​  ,
     
    Have the code worked for you ? I tested it and seems to generate errors.
     
    code
     
    the errors after the simulation was performed and F2 executed.
    errors
     
    different error from Post-Processor after the file "new_values.cmd" was executed.
    error
  • Yes, it worked for me. Your model is named ".sample", right? Otherwise you have to edit the file first and replace the references.
     
    I'm fascinated by teh first error you got, never seen anything like that before.