Hi all,
I am using the gear AT plugin to simulate a transmission.
The model is running without issues and the results are correct (rotational speeds, bearing forces, etc.).
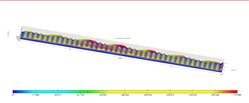
The contact pattern, however, shows a lot of peaks (see picture), which correspond to the meshing nodes position along the lead direction of the gear.
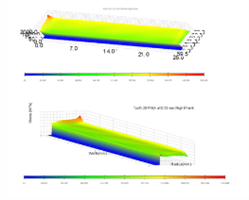
I would like to obtain a plot similar to the one of the "getting started" tutorial (see picture).
I already tried to increase the mesh density, but this only increases the number of peaks.
Also, reducing the error tolerance and Hmax seems not affecting the plot.
Does anyone know where the issue could be?
Thank you
Attached Files (2)