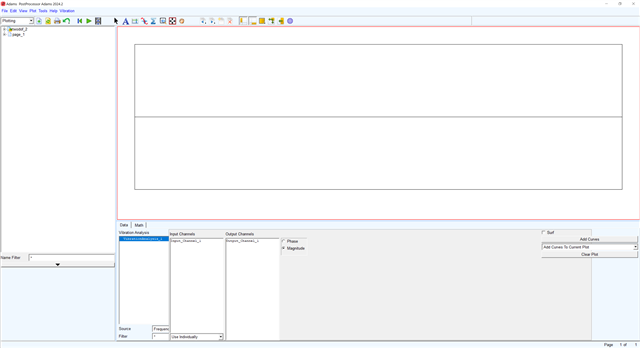
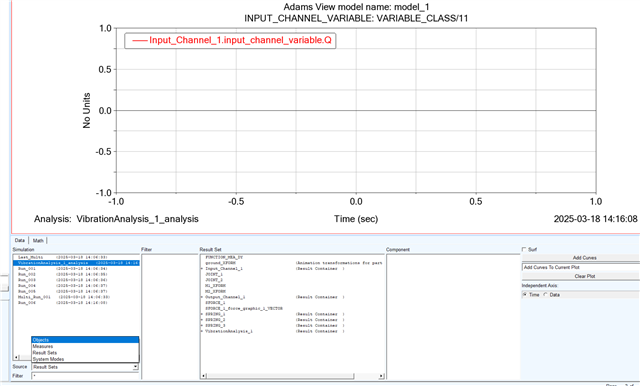
I'm trying to go through an ADAMS/Vibration example. This is the 2-mass, 3-spring "Validation" model. I can get things to run but never seem to see the vibration results as shown below in the ppt. (The image below was generated from a "completed" version of the model saved in a different .cmd). How do I get this to show up? The instructions in the example just say to "Plot the magnitude frequency response from the vibration analysis" with no clues...