hexagon logo

Identifying suspect mesh elements

Dear Community,

In case of running into problems with a run, probably due to mesh quality or density, what is the best way to visualize where this is occuring?

Thanks in advance for your answer.

Best regards,
Christophe

Parents
  • Hello Christophe,

    Thank you for your question. I understand that you are using scFLOW to run your analysis and you need to visualize where the problem is located in your model.

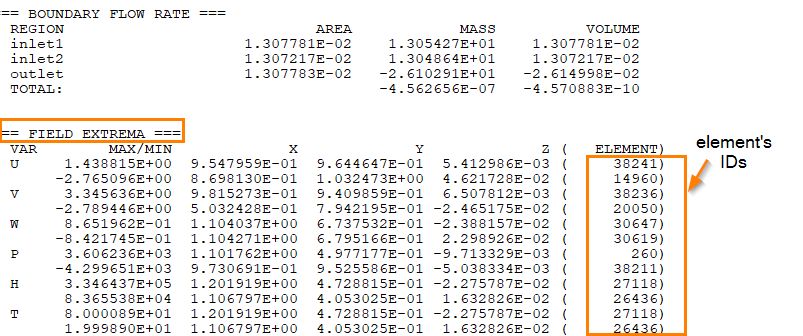
    The best way to do this is by examining the information in the LFile (.l format log file generated during the analysis). In each cycle, the section “FIELD EXTREMA” will display the maximum/minimum values of the variables being solved and the element ID where these occur, which is written at the end of each line.

    By double-clicking on these IDs, you can check whether the issue consistently occurs at the same element or if it shifts. If you identify the cycle where sudden peaks in the variables appear and the simulation diverges, you can pinpoint the element where this happens.

    Once you have the ID, you can locate the element in your model using the postprocessor by following these steps:

    1. Load the result file (.fph) into scPOST. If this file is not available, you can also load the mesh file (.gph).

    2. Click [Create] - [Information] on the menu bar to create an “Information” object. You can also access this feature from the toolbar as well.

    3. In the “Information” object, go to the [Element Coordinate] tab, activate the [Element] checkbox, and enter the ID you previously found.

    4. The element will be displayed in the draw window. You can adjust the settings to customize the visualization according to your needs.

    I hope this helps. Let me know if this is useful in your case.

    With my best regards,

    Oscar Lorenzo

Reply
  • Hello Christophe,

    Thank you for your question. I understand that you are using scFLOW to run your analysis and you need to visualize where the problem is located in your model.

    The best way to do this is by examining the information in the LFile (.l format log file generated during the analysis). In each cycle, the section “FIELD EXTREMA” will display the maximum/minimum values of the variables being solved and the element ID where these occur, which is written at the end of each line.

    By double-clicking on these IDs, you can check whether the issue consistently occurs at the same element or if it shifts. If you identify the cycle where sudden peaks in the variables appear and the simulation diverges, you can pinpoint the element where this happens.

    Once you have the ID, you can locate the element in your model using the postprocessor by following these steps:

    1. Load the result file (.fph) into scPOST. If this file is not available, you can also load the mesh file (.gph).

    2. Click [Create] - [Information] on the menu bar to create an “Information” object. You can also access this feature from the toolbar as well.

    3. In the “Information” object, go to the [Element Coordinate] tab, activate the [Element] checkbox, and enter the ID you previously found.

    4. The element will be displayed in the draw window. You can adjust the settings to customize the visualization according to your needs.

    I hope this helps. Let me know if this is useful in your case.

    With my best regards,

    Oscar Lorenzo

Children