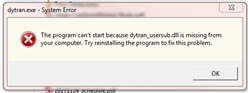
Attempting to use a command line method to launch Dytran results in a system .dll missing error message. Has anybody got a reliable way of running Dytran (with options) from the command line?
Hi John, we've updated Dytran Explorer in 2016 with a new code base so are working to add all the features in previous versions. In 2017 we added the direct input to the user subroutine location and the latest 2018 release we have added the ATB input capability.
To run via the command line with older versions you need to add some environmental variables:
set MP_SPIN=10000000
set DPL_FLEXLM=True
set DPL_NCPUS=1
set OMP_NUM_THREADS=1
set DMP_MAXCPUS=1
(where 1 can be changed in all above to number of cores for SMP parallel for structural analysis)
set PATH=c:\msc.software\dytran\2016\usr-subrtns;%PATH%
(this pulls in the default dytran_usersub.dll that is used in all cases and the error above)
Thanks Doug, Aman also sent the same fix, which l had missed from a search on the support/doc site. Acknowledge the Dytran Explorer enhancements planned for future release.
Model is now running!
I am in the transition from LS-Dyna3d to Dytran, looking forward to having some improved functionality for Dytran decks in Patran (and Apex) in the future.
All the best - yes I would also recommend to look at Paraview for great post processing animations and fluid visualisation tools (like isovolumes). Dytran comes with a converter to convert ARC to VTU/PVD files. If you use Open With... in windows and select the arc2vtk.exe in the dytran installation it should be set for future use.
I have been using it but so far managed to get the Eulerian elements as fuzzy blobs. Plotting the Langrangian elements is OK. Animations are painfully slow.
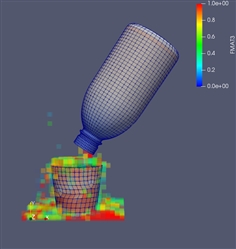
The Dytran example problem for example, pouring the liquid from a bottle looks as per attached picture.
Another learning curve. The MSC course notes are quite sketchy when describing Paraview for post-processing. The animations on the web are Paraview based - l guess l am missing some switched features.
Ah, just a few steps needed here. Since Dytran results are stored per element you need to use the Paraview Filter-> CellDataToPointData that interpolates and averages the element results to the nodes (Patran does this automatically based on the element shape function etc). Once you have that you need to have FMATPLT as an Euler element output request (an improved version of FMAT when using coupling surfaces). This is the fraction of material inside a cell. You can then use it with the Paraview IsoVolume filter and select the range between 0.5 and 1.1 (all cells half filled line until over fill - any value above 1).
This is then what you should see (however this animation has a much finer fluid mesh than the default example):
Paraview is a bit like Patran in the sense that you need to hit the Apply button on the Properties window for things to be loaded (if they are bold in the tree). Then the filters work per tree object, so once you select an item then it will show in the Filters menu what you can do to it. So if you've loaded a PVD file (this is just a text file that links all vtu files with correct timestamp) then select this in the tree and run the celldatatopointdata filter on that (and then isovolume on that resulting item etc). So you see that you can have multiple instances of objects in Paraview, each with its own fringe and visibility setup.