This link helps me plotting the contribution, I am also looking in understanding how to read or interpret them. any documentation related to this will also be helpful.
Good to know that you are able to plot the contributions, now it is easy to interpret. Let me refer the below image(from the article) to explain it:
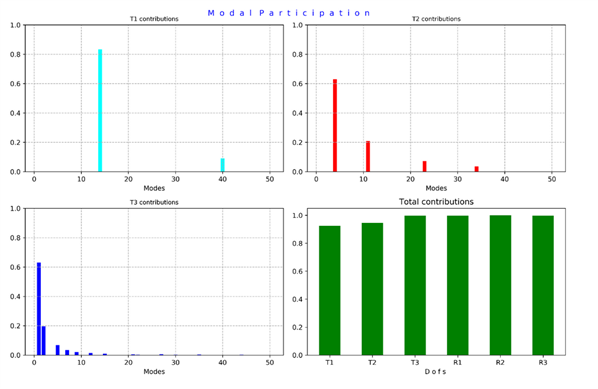
Modes contribution in T1 direction:
Around 82% contribution is coming from mode 14. 10% contribution is from mode 40
Modes contribution in T2 direction:
Around 62% contribution is coming from mode 4. 21% contribution is from mode 11 and so on.
Modes contribution in T3 direction:
Around 62% contribution is coming from mode 1. 20% contribution is from mode 2 and so on.
From all above you can identify the important modes and their contributions.
Total contribution:
Notice that all modes in T1 are contributing around 85%. In T2 direction all modes contributing around 87%. But in T3 all modes are contributing 100%. From this you can identify if you have sufficient modes specially in direction of excitation.
Which means if you have excitation in T3 these many modes are sufficient, but if in T1 then need to ask few more modes such that it should have 100% in T1