The first line loads the selected result into a register (which always seems to be 0...).
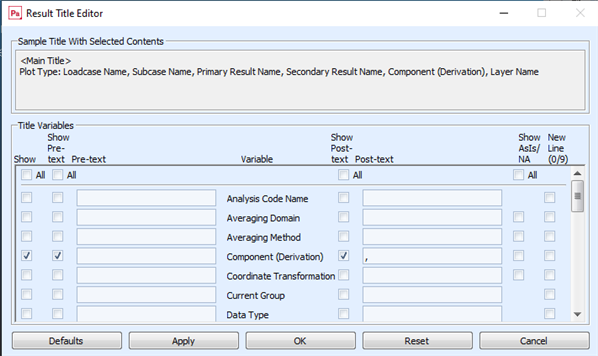
The second line creates the title. Those are variables, and they correspond to what's defined in the Title Editor (under Display Attributes) - usually just the defaults. i.e.:
Plot Type: Loadcase Name, Subcase Name, Primary Result Name, Secondary Result Name, Component (Derivation), Layer Name
The first line loads the selected result into a register (which always seems to be 0...).
The second line creates the title. Those are variables, and they correspond to what's defined in the Title Editor (under Display Attributes) - usually just the defaults. i.e.:
Plot Type: Loadcase Name, Subcase Name, Primary Result Name, Secondary Result Name, Component (Derivation), Layer Name