hexagon logo

reporting show out of tolerance in red, but bar graph in yellow


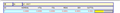
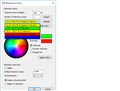
Just using a general report template that I have always used for internal reporting, and lately(not sure when this happened) in the last month maybe, my out of tolerance dimensions are not showing up in red. only the lettering is. But the color bar after it is yellow. Never had this happen before. Computer has been restarted. My settings seem like they normally are. Am i missing something?

Attached Files
Parents Reply Children
  • Looks correct to me. Your measured value is -0.0051 and your tolerance is ±0.005 so you are out of tolerance by -0.0001
    The graphic bar on the report shows yellow because your dimension colours are set up to show yellow for negative out of tolerance.
    The text is only ever coloured black (for in tolerance) or red (for out of tolerance). In this case it is out of tolerance, so it shows red.