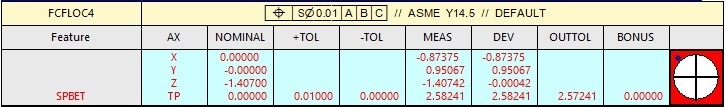
The new GEOTOL_SUMMARY label uses the following code on a repeating row to generate the axes on the report - =TOLEXT(REPORT_LABEL_AXIS:N,DIM_OUTTOL:N,"SEG=1",0.0,0.0)
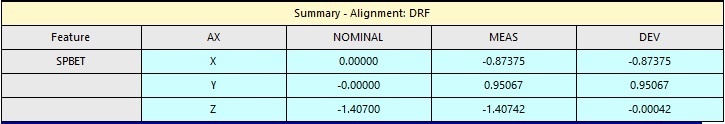
I'm attempting to create a custom report label that separates each axis into it's own row, similar to the old SUMMARY.LBL label. The issue is that the REPORT_LABEL_AXIS seems to be an array of axes, including one for TP. Does anybody know of the proper syntax (if available) to pull the contents out of REPORT_LABEL_AXIS one by one? I've attempted things like
I've tried various integers in each configuration. Interestingly, I can set the row repeat expression to =COUNT(REPORT_LABEL_AXIS) - 1 and it repeats the row one time for each axis (not including the TP axis, hence the "- 1"). Thus, REPORT_LABEL_AXIS surely contains each axis as a countable item.
Also,
Don Ruggieri perhaps you would know why the help files haven't been updated to include definitions for new functions on the reporting side. For example, there is no definition for TOLEXT and REPORT_LABEL_AXIS.
Thank you
bfire85 I think what I'm trying to do is a bit different. I am recreating the SUMMARY.LBL report label to mimic older XactMeasure reports. I don't care for the appearance of the new GEOTOL_SUMMARY label and the spacing of the contents is a bit odd. When trying to center the data within the label, things don't appear centered. All of my coding is being done through the Label Template Editor.
My desire is to make my report look similar to XactMeasure style reporting. See the uneven spacing below from the GEOTOL_SUMMARY report label:
I don't like how cluttered things look and how the spacing/positioning in the Label Template Editor don't seem to work properly. I have created a new summary label that is compatible with the Geometric Tolerance command and eliminates all the weird data spacing that was happening in the report label.
I'll update when I finish modifying the GEOTOL_SUMMARY label to only show the TP (a case in which we won't need the AX column) in case anybody is interested in restoring their 2020 R2+ PC-DMIS to look like the older XactMeasure format.
I'm just surprised that my standard hexagon label for geo-tolerances called "GEOTOL_SUMMARY" looks completely different from yours and I don't have any spaceing problems either Are you sure someone hasn't edited this before you?
anyway:
"REPORT_LABEL_AXIS" always seems to be one line. And you can't separate them that easily. At least I'm stuck in the same place as you
"=TOLEXT" was originally the command "=TOL" the EXT was added to make room for the command "SEG=1".
Otherwise, as far as I can see, the command behaves like "=TOL" and you can find this command in the help file.
I modified the graphic for consistency, I modified the header to look cleaner (in my opinion), and I added gridlines and changed the color of the leading row for the feature. Everything else is the standard label with the quantities "centered". I'm working on updating it further to only show the TP result and put everything else below in a summary label like it was with XactMeasure, but extracting the data is proving to be non-intuitive.
You can parse it easily enough if you use the MID command such that TOLEXT(MID(TOLEXT(REPORT_LABEL_AXIS,0,"SEG=1",0.0,0.0), 0, 1), DIM_OUTTOL:N,"SEG=1",0.0,0.0) will give you the first axis and allow for proper OOT coloring. You can change the last two arguments of the MID function to (2, 1) to receive the second axis. (4, 1) will yield the third axis, etc.... I believe that's how I sorted it earlier. It gets interesting when you're trying to parse the nominal/meas/dev values because you have to use modular arithmetic and they seem to be placed at intervals of 13 spaces, oddly enough. Like I've alluded to, I'm not sure what the logic is behind this new reporting scheme, it seems strange.