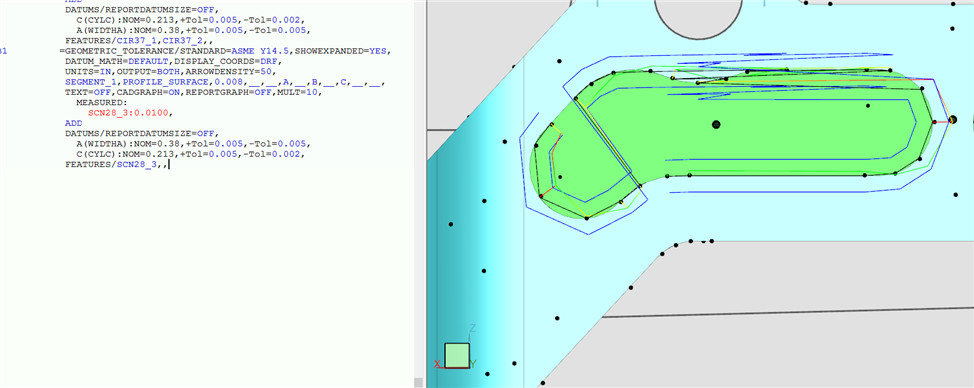
I constructed a feature set from a group of points on a contour to report profile. when I turn the cadgraph on, is there a way in the settings somewhere to turn the blue and green lines off that are showing the tolerance zone. I just want the lines that come off each individual point that show green, yellow or red depending on if they are in or out. These other zone lines are confusing the customer.
Turn off the CADGRAPH for that dimension.
Go to Insert - Report Command - Analyisis.
Select that dimension from the list.
Click View Window. Analysis Window will open.
Select options menu - Dimension Options
Unselect Show lines between nominals.
Click OK.
Close the Analysis Window.
Close the Analysis dialog.
In the Edit Window, turn Cadgraph back on.