I constructed a feature set from a group of points on a contour to report profile. when I turn the cadgraph on, is there a way in the settings somewhere to turn the blue and green lines off that are showing the tolerance zone. I just want the lines that come off each individual point that show green, yellow or red depending on if they are in or out. These other zone lines are confusing the customer.
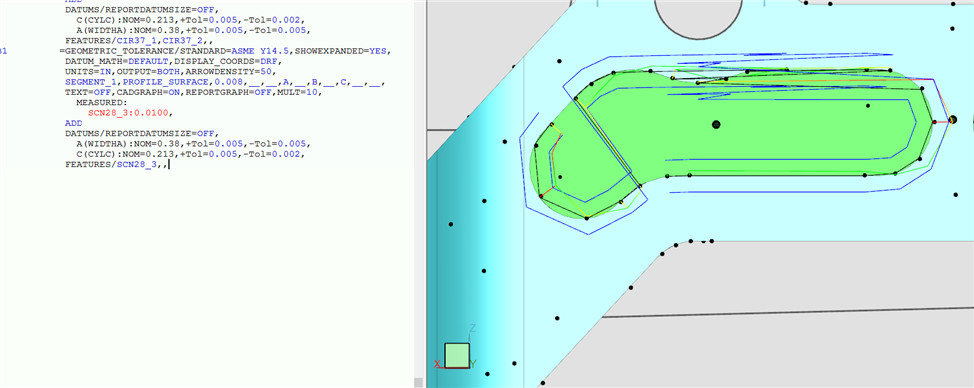
When constructing the feature set its important to pick the points in an order that flows together, other wise your tolerance zone will look much like it does in your picture. Regardless of the order of how the points are actually probed, try constructing the profile by picking a starting point and then selecting the rest of the points in clockwise or counterclockwise order on the model , this should fix you tolerance band.
When constructing the feature set its important to pick the points in an order that flows together, other wise your tolerance zone will look much like it does in your picture. Regardless of the order of how the points are actually probed, try constructing the profile by picking a starting point and then selecting the rest of the points in clockwise or counterclockwise order on the model , this should fix you tolerance band.