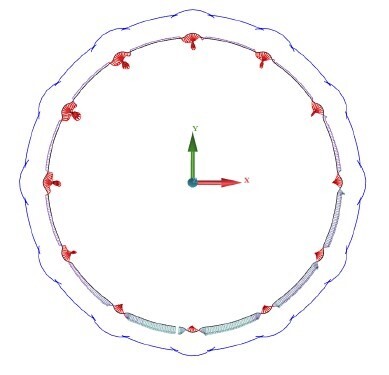
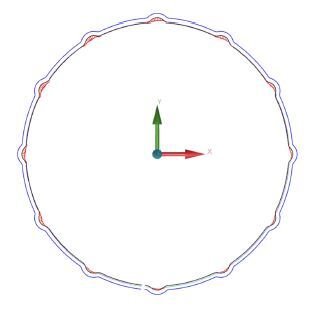
So long story short, I've never used the analysis views. My question is the does the boundary automatically project to the tolerance limit based on the cad/dimensions or is there a setting that needs input to define the profile tolerance. Management has questioned the zone that's being projected on the report and I'm uncertain of the answer. The main concern is the vectors are going both directions. This coupled with production having exhausted all the test parts they have and need to know how much to offset the profile pattern. I'm running 2019 R1 on a global green with a Leitz Scanning head.
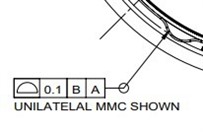
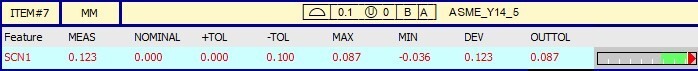
I believe they have an issue with the machining process of the pattern. Any input is appreciated. I'm not impressed with the FCF note either, but I can interpreted the intent at least.
its been a while since i've been on a scanning cmm so grain of salt here, but I think the arrows show plus/minus of the profile not vector of hit.
There is a way to change the size and density of the arrows for a clearer view.
I would approach this by first 1.) making sure that your cad vectors are correct, then 2.) have product engineer make sure the cad model is nominal, then I would have them absolutely specify the unilateral tol. no guessing what they want. Right now you are only getting plus tolerance.
I verified and corrected all the surface vectors already and that made no difference to the results. (difference of .001 MM) The Cad model is within .0001 of what the print specifies for tolerances. Should be exact but I don't foresee getting multiple prints and models updated within the timeline of the due date for this part.
Your graphics looks messed up because your magnification is too high compared to your tolerance. Lower your magnification until the tolerance zone don't crisscross each other like you're seeing.
The arrows start from the model and end at the deviation for that particular point. The blue lines represent your tolerance limit and the arrows and tolerance limits are all drawn to scale according to the multiplier. The +.087 value in the MAX value of the report means that you have a MAX of .087mm extra material relative to the model. The MIN of -.036 means that you have a MIN of .036mm missing material relative to the model. Positive values mean extra material, negative values mean missing material. It looks like you are getting a decent amount of tool deflection when the tool comes into those tighter sections. The difference between your max and min is .087-(-.037)= .124. so tool comp alone will not get you into tolerance. HTH
The profile is set to what the FCF should be based on the note of the MMC condition and was confirmed by management, After running the program again the projected zone seems to have "snapped" to the feature. I'll still be looking for a way to communicate what adjustments need to be made as production is asking me how much they need to offset the mill. I personally think the features need to be offset in the CNC program and the min max on the report should indicate how much to adjust the offsets...