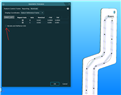
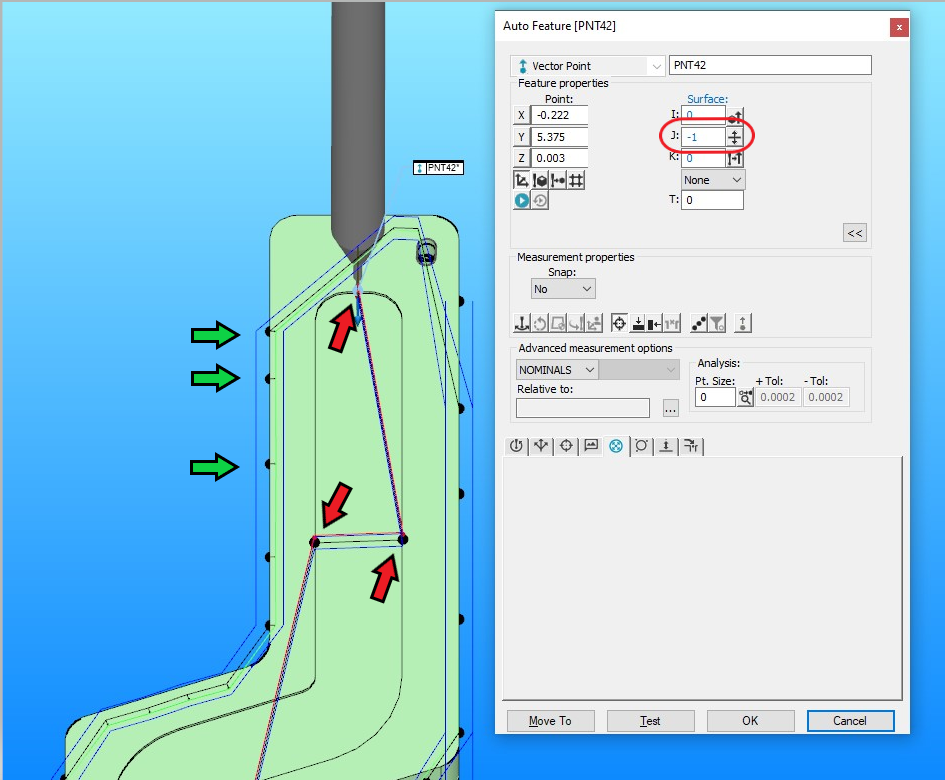
I'm trying to figure out why my profile tolerance band is in the Z-axis, instead of the X/Y-Axis. As you can see below, the green arrows are a different set of points but represent the tolerance band I'm looking for. The red arrows show the points not being evaluated correctly. My points all seem to have the correct vectors with values in I and J, but alas, I'm still getting Z axis deviation. I've created a set of these vector points, and I'm evaluating using surface profile in GeoTol to datums ABC. Everything was measured and evaluated in the Z-Plus workplane.
It should be noted my points are all .003" above Z zero on purpose, because that edge is too shallow for a 0.3mm probe to fit entirely. Our engineers have created offsets to compensate for all that, etc, and whether that's an acceptable route or if this is the right tool for the job won't be the focus here lol. But, if someone thinks the Z-height of my points is contributing, this might be good info to know.
Thanks in advance!