I'm updating an existing program showing a profile.
The old profile showed all of the hits.
Now that it's in GeoTol, it's just showing four hits from each scan. (There are three scans total being reported in a scan set.)
I don't understand why it looks like this.
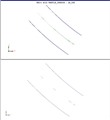
When I turn REPORTGRAPH to 'ON', it shows all of my points, (Shown in picture. The top one is the reportgraph, the bottom is the analysis view.)
(Point of order: I haven't actually run the program yet. Will the points show up normally once there's data, perhaps??)
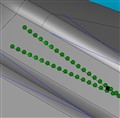
One other question. When I'm looking at the scan on the model, I'm seeing some of the hits have these little x lines through them.
(Shown in picture below). These seem to correspond to what's being reported.
What are these x's? What do they mean?
Attached Files