hexagon logo

viewsets snapshot not working correctly

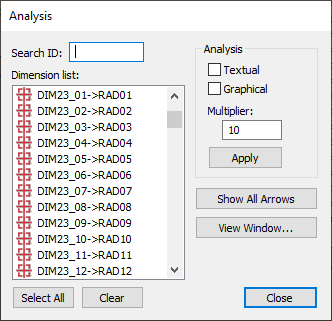
I made some profiles and flatness on. Need to show whole flatness of plane and flatness of little area on this in normal report and in 3D 

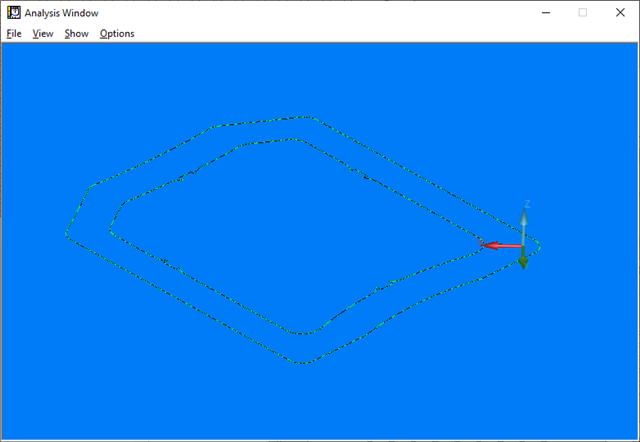
for example i need to show whole flatness  as its shown here: 

and separately small area in yellow "circle"  - sorry no much time for prety drawings 

i made flatness of big part of  plane 
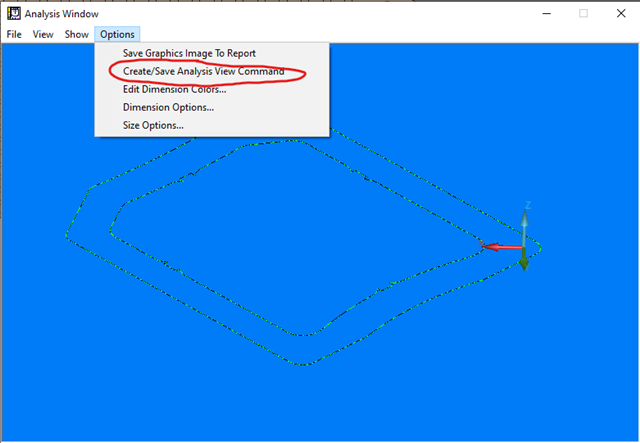
viewset 

recal viewset 

snapshot 

turned of CAD 3D representation in flatnes setings 

and so on few times 

and when i see report - refresh it was everything like i wanted - every characteristic was looking nice 

but after runing program everything is clean pc-problem do not shows any 3D lines except last one where left 3D turned on 

i do not get this, what is the logic of it, how it should be done correctly ? 

Parents
  • Snapshots work independently from viewsets.  A snapshot on it's own will store the features currently displayed on the model, the orientation and position of the model in the graphic window, the current model layers being displayed, the assembly features being displayed, feature label positions, and diminfo box positions.  You do not need to create a viewset to get a repeatable snapshot and changing a viewset will not affect any previously made snapshots.  

    However, one downside of snapshots (and viewsets with screen capture commands - the old-fashioned way to put graphs on the report) is that the CADGRAPH or GRAPH settings for each reported feature is local to those features.  To make the CADGRAPH appear in the snapshot you need to leave the cad graphs setting turned on for those features.  Unfortunately, they can not be set to be displayed in some snapshots without also being displayed in all the following snapshots.  Plus, if you intend to display a lot of those graphs, the model in the display becomes a mess of overlapping cad graphs.  

    The workaround I tend to use is to create a snapshot that shows the features that I want to graph in the orientation that I want the graph to appear.  Then immediately follow that with an analysis view command showing the graph in the same orientation.  The result on the report is first the numerical representation of the data, followed by a picture of the model with the feature(s) being reported, followed by a 3D graphic showing the deviations. I would much prefer to see the graph overlayed on the model, but the workaround to make that work takes more effort than I have time for.  

    A more involved workaround is something suggested by  in the following link: Turn Off Cad Graphs Programmatically   That topic discusses using variables and conditional statements to turn the cadgraphs on/off while the program is running to get the desired graphs overlayed on the model.  I think it is cool, but not worth the effort for the small production volumes I work with.  

  • Thank you Cris_C for your explanation of  this logic and help

    Your idea seems to be best here

    My snapshot and analysis are so spread, any idea ? 

Reply Children
  • I see you used the graphical analysis built into the reporting feature.  There is also a way of putting in the graphical analysis using a separate command.  That is under Insert - Report Command - Analysis.   The window looks like this:

    There you can select the dimensions you want to create a graphic for.  You can do several together if you would like.  Then, click View Window.  That will open the Analysis Window

    There you can orient the graphics the way you want it to appear on the report.  Once you have it the way you like it, click on the options menu and select Create/Save Analysis view command.  That will create a command that will put the graphic in your report.  The nice thing about doing it this way is that you can control the order of the reporting and the graphic fills the full width of the report page.