hexagon logo

Report for probe calibration

hello everyone.

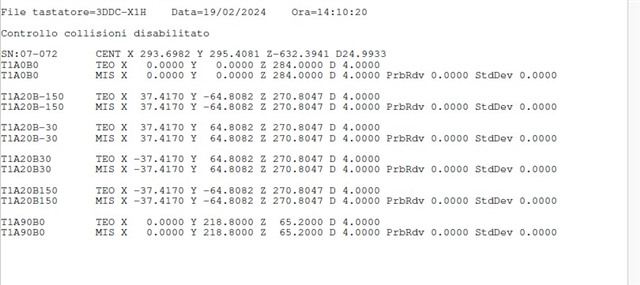
In your opinion, is there the possibility of having a report for the calibration of the probes, similar to that of the dimensions?

In my opinion, the calibration standard for the probes is unclear. If the output was like that of the dimensions, using the labels with the graph, in my opinion it would be much clearer and nicer. Does anyone have any ideas on how to create this?

thank you all

Parents Reply Children
  • Exact ,
    with the automatic calibration command I finally get the results in "text" format, as per the attached image.
    My idea instead was to create a report with labels, legacydimension.lbl style, that gives you the standard deviation of each tip.
    I tried to look but I don't know how to get the label to repeat the number of probe tips. I see that it only repeats with =COUNT(AXIS) and I don't know if there is a =COUNT(TIPS) command.
    Because otherwise my idea was to create a quick script with a for loop to fire the results of each type. As happens with textual analysis.....

  • I don't know what or how you are doing it, but you need to stop whatever it is you are doing.

    don't do whatever it is, it is too hard to read what you are posting when we have to scroll the message window back and forth, back and forth, back and forth, back and forth, back and forth, back and forth, back and forth, back and forth.