The reason is we still use V2015.1 with max min standard. And we have issue with reports which use stepahead to combine multi results. Stepahead doubles the MAX+MIN which failed good parts.
Therefore I have to get single hit data to report hits individually to match the new standard: double the max
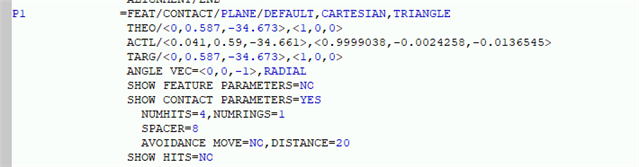
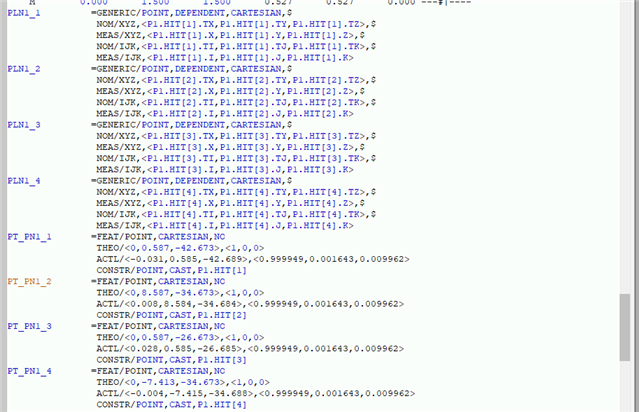
What data did you need from the planes specifically? You can just report the location of the hits if you needed the X, Y, Z.
Or finding the max in a specific axis this way. You can do MAXINDEX to see the highest point. MAXINDICES puts them in an array from highest to lowest in the Axis specified at the end of the variable.
            ASSIGN/V1=MAXINDEX(14PLN.HIT[1..14PLN.NUMHITS].X)
            ASSIGN/V2=MAXINDICES(14PLN.HIT[1..14PLN.NUMHITS].X)
DIM LOC3= LOCATION OF POINT 14PLN.HIT[V1]  UNITS=IN ,$
GRAPH=OFF  TEXT=OFF  MULT=10.00  OUTPUT=BOTH  HALF ANGLE=NO
AX       MEAS    NOMINAL       +TOL       -TOL        DEV     OUTTOL
X       4.9808     3.6794     0.0000     0.0000     1.3013     1.3013 -------->
Y      19.6324     0.7505     0.0000     0.0000    18.8819    18.8819 -------->
Z     -28.4092     0.0000     0.0000     0.0000   -28.4092    28.4092 <--------
END OF DIMENSION LOC3
Here is how you would use MAXINDICES
            ASSIGN/V2=MAXINDICES(14PLN.HIT[1..14PLN.NUMHITS].X)
DIM LOC3= LOCATION OF POINT 14PLN.HIT[V2[1]]  UNITS=IN ,$
GRAPH=OFF  TEXT=OFF  MULT=10.00  OUTPUT=BOTH  HALF ANGLE=NO
AX       MEAS    NOMINAL       +TOL       -TOL        DEV     OUTTOL
X       4.9808     3.6794     0.0000     0.0000     1.3013     1.3013 -------->
Y      19.6324     0.7505     0.0000     0.0000    18.8819    18.8819 -------->
Z     -28.4092     0.0000     0.0000     0.0000   -28.4092    28.4092 <--------
END OF DIMENSION LOC3
DIM LOC4= LOCATION OF POINT 14PLN.HIT[V2[2]]  UNITS=IN ,$
GRAPH=OFF  TEXT=OFF  MULT=10.00  OUTPUT=BOTH  HALF ANGLE=NO
AX       MEAS    NOMINAL       +TOL       -TOL        DEV     OUTTOL
X       4.8723     3.5711     0.0000     0.0000     1.3013     1.3013 -------->
Y      19.4449     0.5631     0.0000     0.0000    18.8818    18.8818 -------->
Z     -28.4079     0.0000     0.0000     0.0000   -28.4079    28.4079 <--------
END OF DIMENSION LOC4
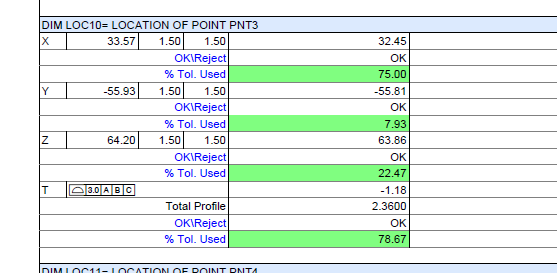
Can MAXINDICES find out the max T value? I try to report 18 hits cylinder profile. That is a lot, if Max T value could be found out , then save me a million.
The location dimensions do have the option for "T" value under the sheet metal section, but I do not have the knowledge to say if that is the same. You'll just need to put in the correct nominals.
The location dimensions do have the option for "T" value under the sheet metal section, but I do not have the knowledge to say if that is the same. You'll just need to put in the correct nominals.