hexagon logo

Profile and Actual Zone

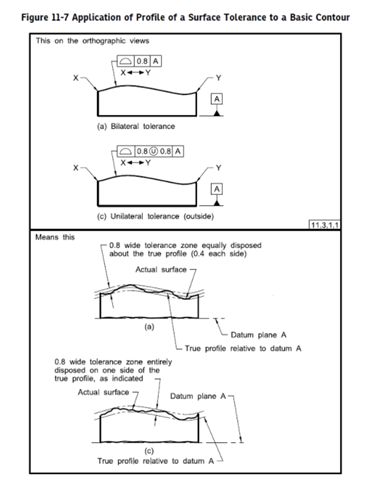
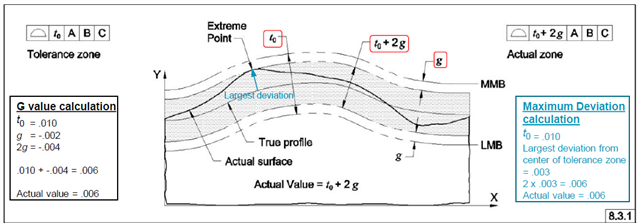
This is a little more of a GD&T standards question as opposed to a PC-DMIS question-- and probably a rudimentary question at that:  According to ASME Y14.5.1 2019, to report out a profile, you take the extreme point on whatever side of the true profile it is, and double it to get the "actual zone."  This is how profile is to be reported whether we're checking the profile manually with an indicator or using inspection software.  My question is why is this the way to calculate it as opposed to adding the highs and lows together (FIM) like a form or orientation inspection?  Engineers have asked me about this before and the most elementary way of answering it was to tell them that the profile result was representing what the profile tolerance "would have to be" in order to pass because doubling that value created a new zone (actual MMB and actual LMB).  I'm still not entirely sure why.

For the record, I never read the actual ASME Y14.5.1 2019 text; I only watched videos about it so there's a good chance that I'm missing info.

Parents
  • It's similar to how position works - for position, you take your deviation from the nominal location (basic dimensions) - which is a RADIAL value - and then multiply it by 2 in order to compare it to the position tolerance - which is a DIAMETRIC value.

    The definition in ASME Y14.5.1 - 2019 (math standard) is quite complicated, talking about "g" values that grow or shrink simultaneously from each tolerance zone boundary until they make contact with the actual profile.

    If you break this down (compare the ASME definition in black on the left hand side to the blue section on the right of my screenshot) you can see that this is mathematically equivalent to working outwards from the centre of the tolerance zone to find the largest deviation and then multiplying it by two.

  • Comparing it to position helps to put things into perspective.  Oddly enough, I've always used the fact that profile is radial when applied to holes and applying the tolerance to a basic diameter dimension to know what go/nogo pins to use, but I never really thought of it that way when applying it to a plane/surface.  Thanks for the insight.

Reply Children
  • This is how we handled it with our engineers when they were very confused by our "new" reports that said the parts are much worse than they have ever been!!!!
    Which they know because we have saved reports and the full programs that measured them going back to 2013 for most things. (quite the pile of data) 

    Sorry for the formatting, its Friday and the end of the day at that! And I'm still having a bit of PTSD from Neil's mention of orthogonal planes which our engineers think is the BEST way to 100% control all features of every part instead of actually dimensioning things...

    ---------------------------------------------------------------------------------------------------------------------------------------------------------

    As to the profile of surface dimension, there is a story there.

    Recently it has come to our attention that back in the second half of 2020 Hexagon updated their PCDMIS software to fully utilize the most recent revision of ASME Y14.5 which was released in 2018.

    Our facility currently uses two versions of PCDMIS, 2020R1 and 2020R2. The latter version of R2 fully implemented the ASME Y14.5 2018 standard, and by extension the ASME Y14.5.1 2019 standard which deals with the mathematical calculation of all GD&T.  


    Specifically related to this instance, ASME Y14.5.1 2019 changes the way profile of surface is calculated and reported.

    Previously per the Y14.5.1 1994 version it would be expressed as a value on the positive side of tolerance and value on the negative side of tolerance.

    The report would display the results with a traditional +/- scale like this with zero being the center.         (PCDMIS 2020R1)


    The Y14.5.1 2019 version changes the expression to isolate the point with the highest deviation and preform the calculation and display results for only that point.

    Furthermore, the results are now displayed as a linier scale with zero being on the left and the result filling to the right.   (PCDMIS 2020R2)

    I will not bore you with complicated math equations and just explain how it works per the Y14.5.1 2019 revision.


    Using   as an example. Version 1994 would treat this as 3.0 +/-1.5

    If the largest measured error was 1.5 then it would show anyone reading the report the misleading value of “1.5” which really would mean the part was very nearly out of tolerance and lead to confusion as to “why is the part not good enough”

    If the measured error was 1.7 it would be difficult to explain why the part is out of tolerance when “it says 1.7 here and the allowed error is up to 3”


    Again using   as an example, version 2019 would treat this as 3.0 +3/-0.0

    In an apparent effort to avoid confusion while communicating between inspectors and vendors and different industries the standard was changed to essentially take the point with the worst measured deviation and double that result, instead of use a confusing bi-lateral tolerance.

    Thus if the largest measured error was 1.5 the new formula would report the value 3.0 which clearly correlates to the stated tolerance which has a maximum allowed value of “3”. This should allow whoever is reading the report to know that the part in question is at its maximum tolerance and an immediate action is needed.

    If the measured error was 1.7 now it would be reported as a value “3.4” which is clearly over the allowed error of “3” and clearly trigger the need for an immediate correction.


    In either case of the examples, if the measured value is over 1.5 the part in question is out of tolerance. Now per the 2019 version it is just a bit easier to explain “why the part is bad” because the results now follow a straight linier scale vs the bi-lateral scale from before. 

    ------------------------------------------------------------------------------------------------------------------------------------------------------------------------------------------