I'm new to the forums and DMIS in general. So far I seem to have everything down good except for this one nagging issue: How to measure a scribe line on a contoured surface. I've asked experienced DMIS users and people at Hexagon and no one has been able to give me an answer. So i'm reaching out to you guys.
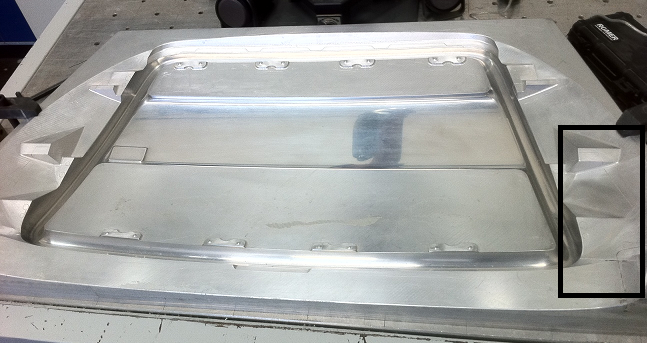
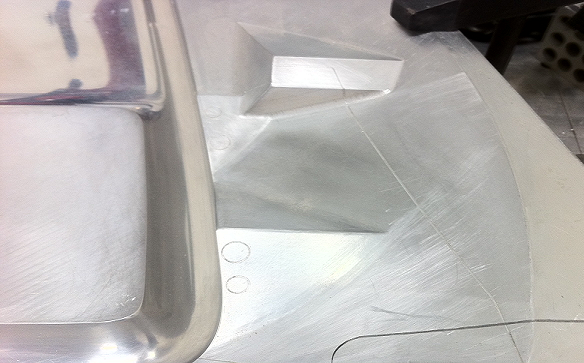
I understand that if a part is 2 dimensional all you have to do is create a profile of a line dimension and just look at the workplane it is on. But how do you do it with a 3 dimensional part, for example:
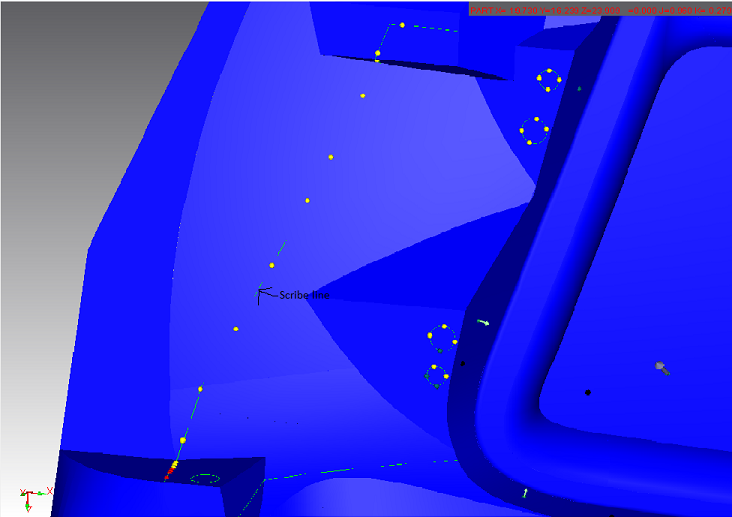
When I do a line profile on that scan i get numbers all over the place (+.8,-.8). You can see in the screen shot that the points are right on the line. The line in the CAD is not an actual groove, but a line on that surface.
I also need to be able to eliminate any error in the depth and just look at the straightness of the line. I know in other softwares that I've used you would just project the points to the CAD surface and it would analyze to the line.
I really need to get this figured out, parts like this are the bread and butter of the place I work. We haven't had inspection capabilities until we got a Romer Arm. Now that we have one, customers want to send over the tight tolerance molds but we're on hold because we can verify the scribe lines properly. Any help or guidance would be greatly appreciated, thanks.