How do I use the XY Chart functionality in Apex? I click on the lime green graph button in the top right, but then I can't find any way to edit or add data to the chart that shows up.
How do I use the XY Chart functionality in Apex? I click on the lime green graph button in the top right, but then I can't find any way to edit or add data to the chart that shows up.
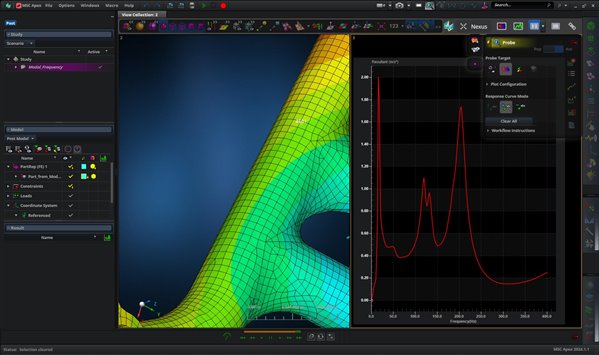
You first need to create a fringe or vector plot of the response you are interested in, then select the green graph button. Once the blank chart is up, select the Probe tool and select the node/element you are interested in plotting the response for.
You first need to create a fringe or vector plot of the response you are interested in, then select the green graph button. Once the blank chart is up, select the Probe tool and select the node/element you are interested in plotting the response for.