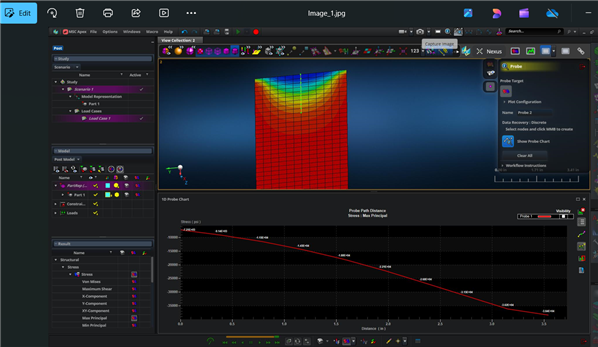
How do I use the XY Chart functionality in Apex? I click on the lime green graph button in the top right, but then I can't find any way to edit or add data to the chart that shows up.
How do I use the XY Chart functionality in Apex? I click on the lime green graph button in the top right, but then I can't find any way to edit or add data to the chart that shows up.