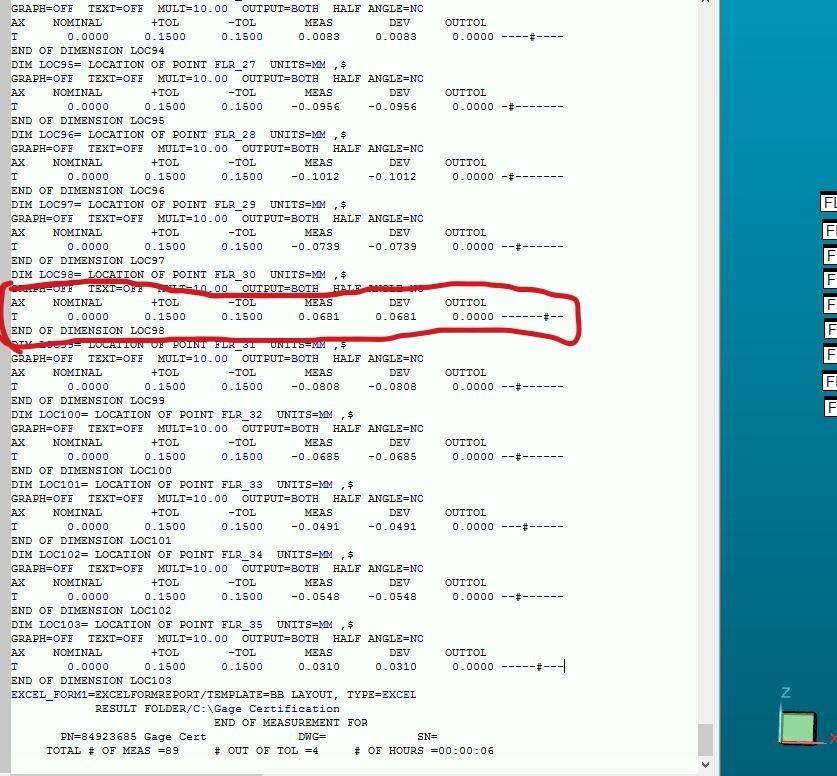
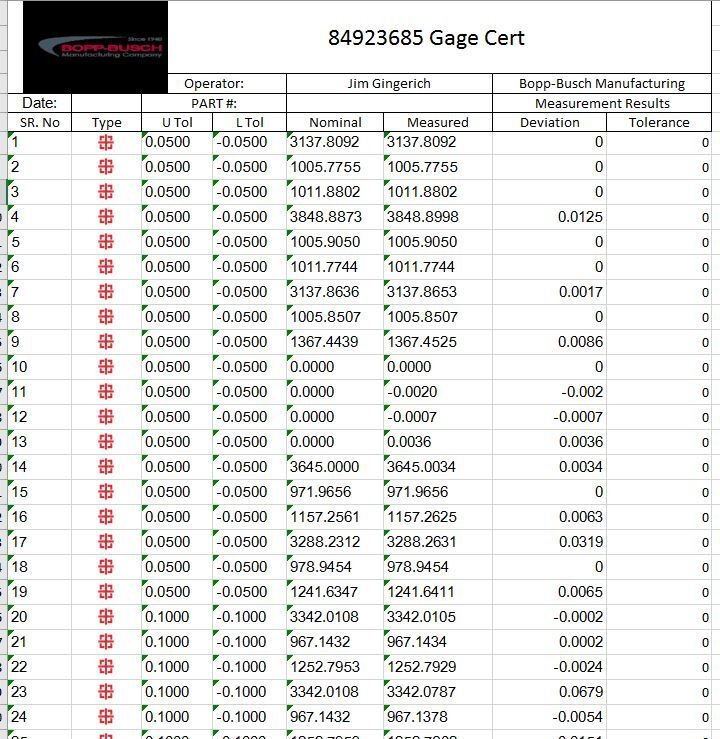
Very new to PC Dmis, I used Open Dmis for 8 years. I would like my Excel Report to reflect the Open Dmis output style. While I am trying to figure this out, I noticed that the command mode text is exactly what I am looking for as an output. Is there a simple way for a beginner to do this? This is what I have, versus what I want, (AX, Nom, +Tol, -Tol, Meas, Dev, OUTTOL, --+----)
the left image is legacy report mode, never seen what is on the right. IF you want what is on the left to be what Excel looks like, not sure how you do that.
On newer versions of the software, for at least the last few of years, there is an Excel form report command. With it you can create a template in Excel that the measurement results will be put into. You can choose what data to display and in what order. It also supports the .xlsm format if you want your template to have embedded macros. I get the impression that it keeps the original formatting when adding data so you can use conditional formatting to do things like make out of tolerance features have red text and things like that. I haven't messed with it much, so I can't give much advice about it. But I thought it was worth mentioning.
in pcDMIS 2021.2 and below you can't really change the columns in the Excel output.
I don't know if this can be changed in 2022.2.
you could at most call up the data from the pcDMIS Excel file in a second Excel file and create an output there according to your wishes.
I can't estimate how much work it would take to do this.
You could archiv this with a basic script, but the effort involved is way beyond "simple way for a beginner"
The Excel output can be formatted any way you want it. My audit programs are set up to measure one or two parts. Operator is prompted to enter 1 or 2. Results are output to a .csv file, each type of feature is targeted to a specific cell in the .csv report.
Here is an example. The code - FILE/WRITELINE,FPTR,"" - skips a row while the code +","+ advances to the next column.
The characters within quotes appear as text in the output and the next line sends the measured value of the feature. This particular form allows for reporting of features not measured on this part and skips over the destination cells for those features.
Thanks Don, I have never used .csv files and not even sure what they accompany. Do you know if it is possible to just simply put a script in the excel form cell I created, and that could change the font color. I would really just like to the form on the left and have the text turn red when it is out of the tolerance band.
Bopp Busch MFG Sorry for taking so long to respond. The .csv files output to Excel in Comma Separated Values. They can be saved in Worksheet format and then you can use Conditional Formatting for OOT results. HTH.