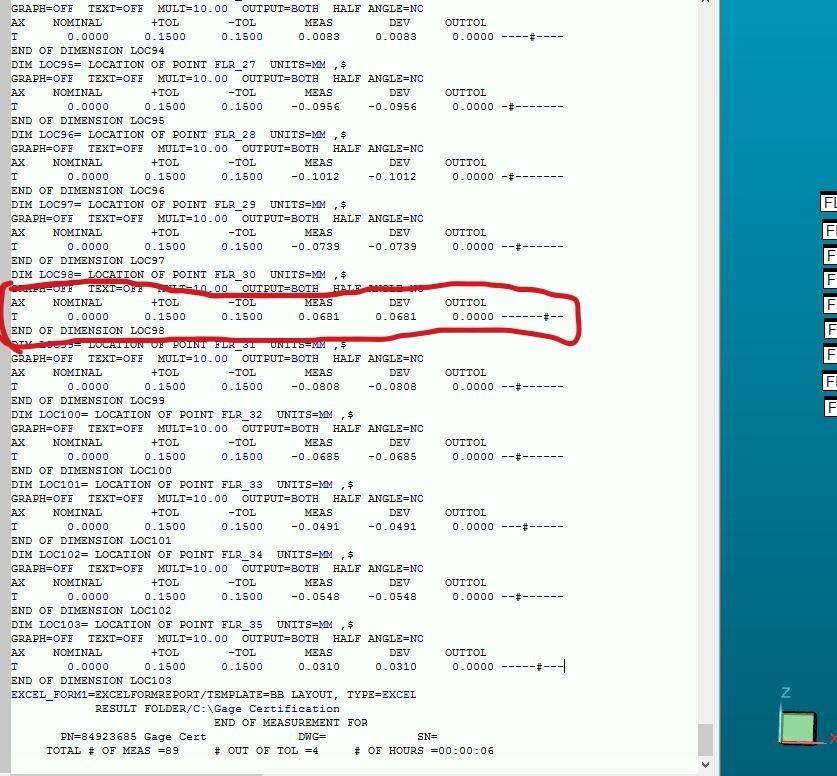
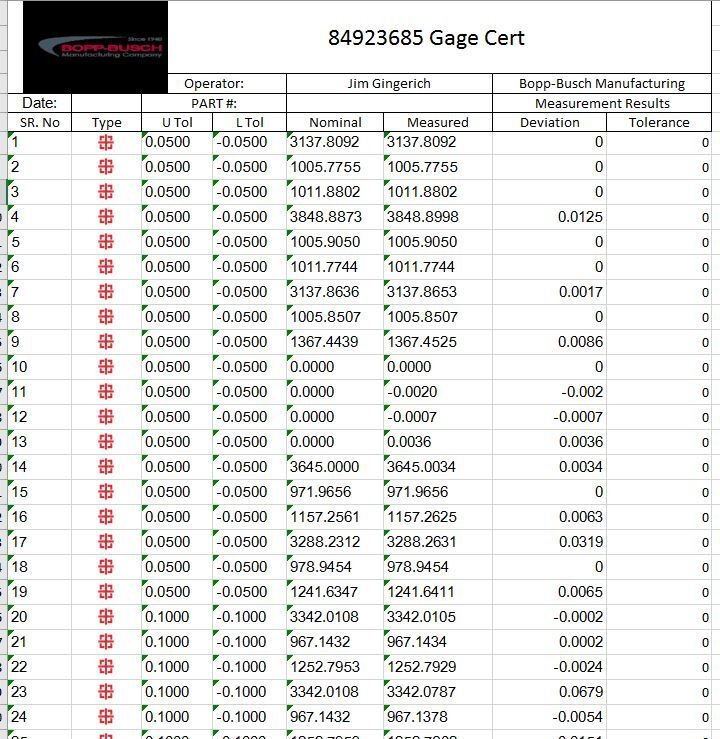
Very new to PC Dmis, I used Open Dmis for 8 years. I would like my Excel Report to reflect the Open Dmis output style. While I am trying to figure this out, I noticed that the command mode text is exactly what I am looking for as an output. Is there a simple way for a beginner to do this? This is what I have, versus what I want, (AX, Nom, +Tol, -Tol, Meas, Dev, OUTTOL, --+----)
On newer versions of the software, for at least the last few of years, there is an Excel form report command. With it you can create a template in Excel that the measurement results will be put into. You can choose what data to display and in what order. It also supports the .xlsm format if you want your template to have embedded macros. I get the impression that it keeps the original formatting when adding data so you can use conditional formatting to do things like make out of tolerance features have red text and things like that. I haven't messed with it much, so I can't give much advice about it. But I thought it was worth mentioning.
On newer versions of the software, for at least the last few of years, there is an Excel form report command. With it you can create a template in Excel that the measurement results will be put into. You can choose what data to display and in what order. It also supports the .xlsm format if you want your template to have embedded macros. I get the impression that it keeps the original formatting when adding data so you can use conditional formatting to do things like make out of tolerance features have red text and things like that. I haven't messed with it much, so I can't give much advice about it. But I thought it was worth mentioning.