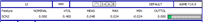
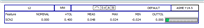
You should be able to see the MIN and MAX values on the report. The value reported will be 2X the absolute value of the MIN or the MAX- whichever value is further from nominal.
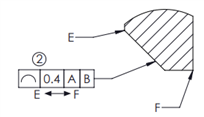
0.4 is +/-0.2...it's just showing that. 2022.2 uses the updated ASME standard that doubles the worst deviation. In your case here, your deviations are 0.024 on both sides, so the measurement is 0.048. If you are seeing up to 0.3 (against 0.4 total tolerance band), that means one of your deviations is 0.15, which that individual deviation is still within the +/-0.2, which is still good.
I believe there's a setting under F5 or F10 that enables Min/Max to display. Note that on most versions, the excel printout will always lack this information when FCF dimensions are used, you'll have to use legacy, and have your spreadsheet calculate the results.

 .
.