hexagon logo

Unilateral profile Geotol vs Legacy

I recently changed employers, and went from a 3rd party inspection company using PCDmis 2014 to a manufacturing company using the latest and greatest (2023.1 currently). At my previous employer we also only used legacy dimensions, unless datum shift was involved, and even then we only used it if the dimensions were out of spec without datum shift. I have a unilateral profile, and I'm trying to use the report to tell the machinists where they need to make their adjustments, but I'm getting some confusing max/min results when reporting using Geotol. See the photo below (I hope this is the best way to attach a photo here)

/community/resized-image/__size/640x480/__key/communityserver-discussions-components-files/694/pastedimage1705672873519v1.png

With my deviation here only being allowed to be negative from the nominal, I'm a bit confused as to why Geotol lists a positive number for my max. Today this profile is good, but yesterday it was bad, and I was struggling with my explanation as where they needed to move. I finally just got the t values of the points that were out and used that deviation to tell them what to adjust. Can someone help me understand this? 

Parents
  • There are more eloquent people here with much fancier words... But in 2020 they changed PCDMIS to update to the new ASME spec which changed how profile measurements are expressed. 
    With the old spec it was shown as a +/-.005 result with half your tolerance above and half below, now it starts at zero and only counts "up" so 0.0 - .010 range. 

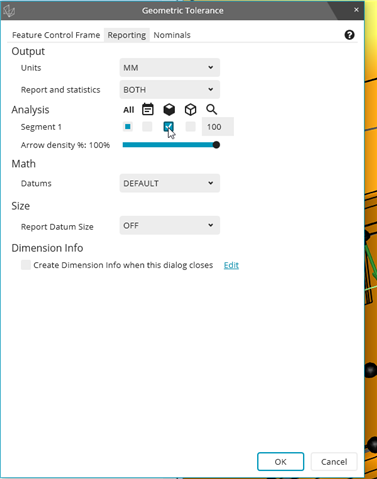
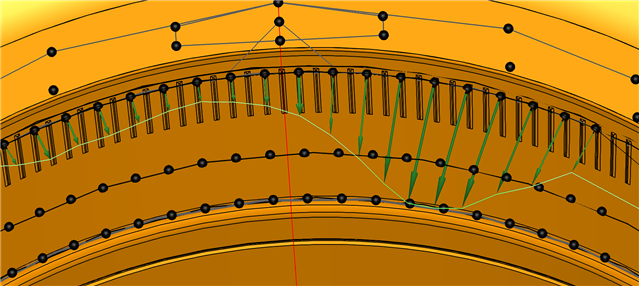
    If you are ever confused by what its telling you then go to your profile feature and turn on "CAD Graphics" and it will give you a nice little leader arrow for each point in your profile. You can use the arrows to explain to your shop monkeys what do to, basically you want to go the opposite direction of the arrow to "fix it". (only about 1/4 to 1/2 the error amount, depending on the situation)

  • Thanks  . I do use the graphics display window (after turning off all the lines besides just my arrows so I can see lol). I used that so I could see which points I needed to check the T values for. The negative T value matched my minimum value from my legacy profile dimension as expected. What I can't seem to wrap my head around is that if I'm expected to use Geotol (Or Xact, if I remember correctly), how am I supposed to get that -.0056 minimum value shown as the legacy min, and what is that positive 0.0022 max value even doing in my Geotol result. There are not supposed to be any positive T values if my profile is unilateral with 0 max material allowed. Is that value actually negative? I do understand why legacy and Geotol results aren't going to match exactly, but I would expect the max/min results to be similar, and definitely not a positive value.

Reply
  • Thanks  . I do use the graphics display window (after turning off all the lines besides just my arrows so I can see lol). I used that so I could see which points I needed to check the T values for. The negative T value matched my minimum value from my legacy profile dimension as expected. What I can't seem to wrap my head around is that if I'm expected to use Geotol (Or Xact, if I remember correctly), how am I supposed to get that -.0056 minimum value shown as the legacy min, and what is that positive 0.0022 max value even doing in my Geotol result. There are not supposed to be any positive T values if my profile is unilateral with 0 max material allowed. Is that value actually negative? I do understand why legacy and Geotol results aren't going to match exactly, but I would expect the max/min results to be similar, and definitely not a positive value.

Children
No Data