hexagon logo

Surface Profile Callout Differences Between Individual and Combined Scans in PC-DMIS

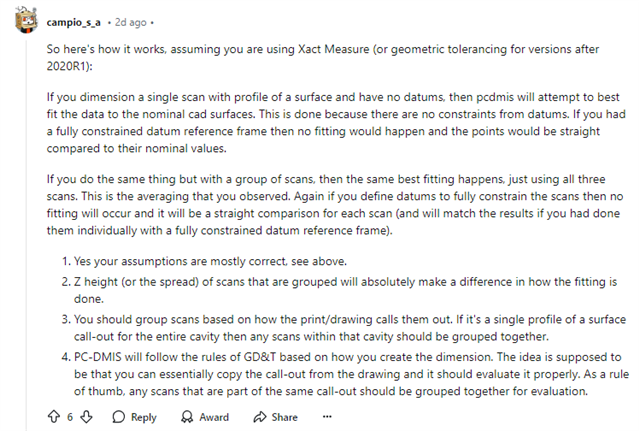
I’ve been working with PC-DMIS and noticed discrepancies when analyzing surface profile callouts on grouped scanned data. Here’s what I’m observing, and I’d like to confirm if my understanding of the underlying calculations is correct.

Observations:

  • I collected three scans at different z-heights:
    • Scan 009-SCN051: Taken at -0.13175 z-height.
    • Scan 009-SCN052: Taken at -0.2505 z-height.
    • Scan 009-SCN053: Taken at -0.36925 z-height.
  • When I create a surface profile callout on the grouped scans, the result differs from what I expected based on the individual scan data. The new result appears to be a blended or averaged deviation across the combined dataset.

Context and Assumptions:

Here are my assumptions about how PC-DMIS handles surface profile calculations:

  1. When a surface profile callout is applied to a single scan, PC-DMIS calculates deviations relative to the nominal values for that scan alone.
  2. When multiple scans are grouped, PC-DMIS merges the datasets and recalculates deviations relative to the entire combined set of points. This often results in a “blended” statistical representation that differs from individual scan results.
  3. The variation in z-heights may influence the combined calculation, potentially leading to differences in the grouped analysis compared to the individual datasets.

My Questions:

  1. Are my assumptions about how PC-DMIS processes individual and grouped scans for surface profile callouts accurate? If not, what is the correct explanation?
  2. How does the variation in z-heights (where the scans were taken) impact the combined surface profile calculation? Would alignment inconsistencies between scans exaggerate these differences?
  3. For reporting purposes, should I prioritize individual scan results for localized accuracy, or the grouped scan result for a global deviation? Does this depend on specific application requirements?
  4. Are there best practices or settings in PC-DMIS to ensure consistency when handling grouped scans for surface profile callouts?

I’d appreciate any insights or guidance on whether my understanding is correct and how best to approach this scenario in PC-DMIS. Thank you!


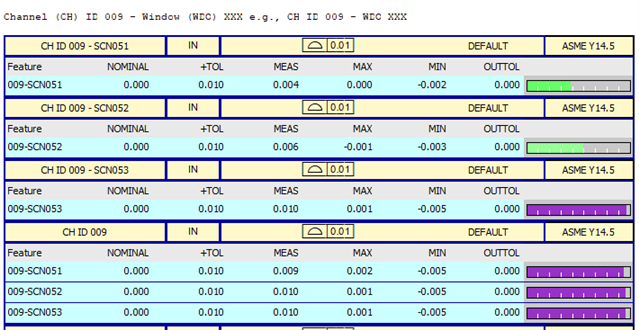
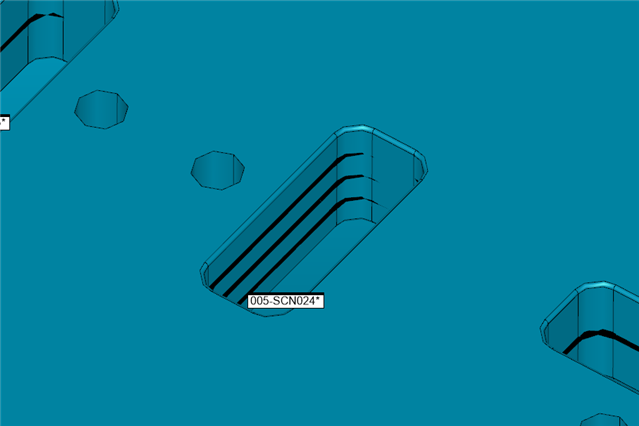
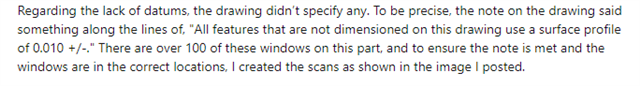
I want to clarify that this question stems from how I’m presenting the results in my report above. I captured each of the scans separately and performed the surface profile callout afterward. I only noticed the discrepancy because, in some cases, I was performing a single line scan in the middle of the feature, while in others, I performed three line scans. This led me to observe a pattern: when combining the three scans for a single callout, the result appeared to average out the deviations, as seen in the combined callout.

After repeating this process about five times on five different rows of holes, the pattern became more apparent. That’s when I stopped to investigate whether there was a difference between calling out scans independently versus combining them. For reference, these were linear scans.


Added more info.
[edited by: NASA_Metrology at 11:01 PM (GMT -6) on Jan 3, 2025]
Parents
  • I posted this same question to Reddit there has been a lot of conversation on this posted topic.

    www.reddit.com/.../

  • Reading through the Reddit posts, this one pretty much explains what is happening...

    Profile of a surface applies to the ENITRE surface(s) it is attached to.  By analysing each scan separately, the fitting is only optimised for that particular scan's set of hits (ignoring the rest of the surface) and is therefor not satisfying the design intent.  Are you able to share the drawing (or at least snippets of the relevant information)?  I'm particularly interested in the note you mention...

    It would also be useful to see which surfaces this applies to and what datums are being used for other callouts.


  • That is the note I was talking about. I cant share the whole drawing online but that one note is okay. Also, that reddit post significantly helped a lot. the community over there pointed out a lot of things to my that I was not thinking about. 

  • We have some prints here where it has a similar callout. In the event of the example below, we would apply .03± tolerance

  • The note   shows is how I would normally expect to see this kind of requirement conveyed.  By requiring all surfaces to be relative to a fully constrained datum reference frame (A|B|C in this case), they are controlling the relationship between all of the surfaces and all of the other features on the part and thus, ensuring the part will assemble correctly.  There are a few problems with the note   shows...

    1. There is no relationship between the surfaces and datums or other features on the part.  It is just a general profile of a surface to no datums.
    2. Strictly speaking, the hits taken on all of the surfaces that the note applies to would need to be analysed in a single profile of a surface command.  This is to ensure they all optimise as a single group.  With  example that references a fully constrained DRF, you could create separate profile of a surface dimensions for each surface if preferred.

    .

       If I were you, I would go back to whoever issued the drawing and ask them to confirm exactly what they want.  Do they want to ensure all of the surfaces that haven't been explicitly dimensioned fit within a certain envelope that is completely independent of any datum structure and has no relationship to any other features on the part (this is what the current note actually means) or do they want to make sure EVERYTHING on the part is in relationship to each other and controlled within a certain envelope.

  • I was told(not taught sadly) that if there is a dimension that is a linear distance using the .03 profile to A|B|C that it effectively means ±.03. Because both surfaces have a profile of .03, which would be an equally split tolerance of ±.015, that would compound to .±.03 because it allows both surfaces to move .015 in either direction. Was I misled? Or maybe I misunderstood their explanation. As far as more complex dimensions, I do not think we have encountered anything but distances where I work

Reply
  • I was told(not taught sadly) that if there is a dimension that is a linear distance using the .03 profile to A|B|C that it effectively means ±.03. Because both surfaces have a profile of .03, which would be an equally split tolerance of ±.015, that would compound to .±.03 because it allows both surfaces to move .015 in either direction. Was I misled? Or maybe I misunderstood their explanation. As far as more complex dimensions, I do not think we have encountered anything but distances where I work

Children