Hi,
Another day, another question 
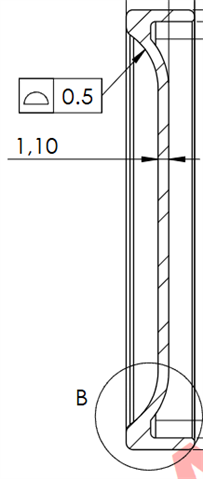
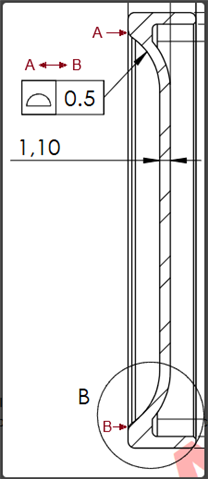
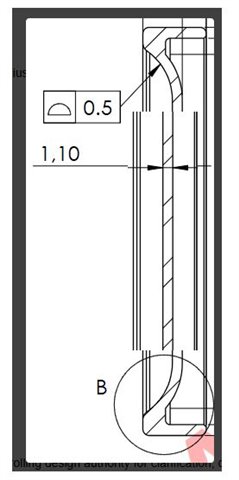
Today i had to check a profile callout (0.5 max - form only), but i find the results a bit strange, maybe i'm missing something but here is what i got :
- Profile is reporting OOT while point cloud colormap shows pretty good values (tolerance set to +/-0.25) while T-value shows something even different :
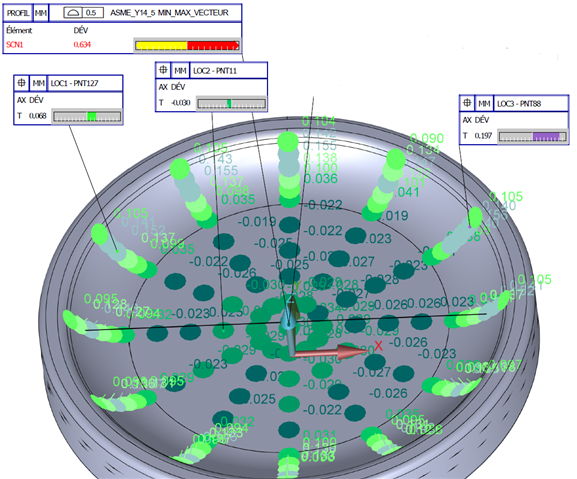
Where is the truth here ?
I would have think the values shown on point cloud are equal to the T-value no ?
For example here the point 88 is reporting 0.140 and T-value is 0.197, point 127 is reporting 0.152 and T-value is 0.068...
Also, if i look at all the values shown, the min is -0.034 and max is 0.155 so i would assume the profile result would be 0.189.
Any idea ?