The work on MSA did not really hold any surprises for the author and contact person for the students. The author has been a consultant for 20 years and has worked in this industry for 32 years, starting out in plastic injection molding.
However, the machine capability conjured up some wonderful data for discussion. This was extremely interesting for the author, as three of his five daughters have been urging him to buy a 3D printer for a long time.
Of course, machine capability depends on the capability of the measuring equipment. However, this small detail was ignored because the first two pieces of work were carried out at the same time, but both students worked together.
It was not just a question of “machine capability.” That would have been far too simple. Two different 3D printers were compared in two different “promised quality levels.”
“Promised quality levels” means: a cheaper 3D printer and a more expensive 3D printer. And ‘more expensive because better quality’ promises the buyer that the components produced will be better.
In both of the first projects, the question of tolerance range arose. Both students found in the classic literature that the tolerance could be “X% of the nominal dimension”...
A funny idea. Paper is patient.
Therefore, the student's task in the term paper was not to determine the machine capability of just one printer, but to compare two printers. And all dimensions were set at +- 0.2.
Interesting results...
Two production units. One with the promise of better “quality” because this machine is more expensive.
All rules were followed. The X components were produced in one piece. All X components were measured in one piece. As stipulated by the rules of machine capability, an attempt was made to eliminate as many influences as possible. A pure view of the machine.
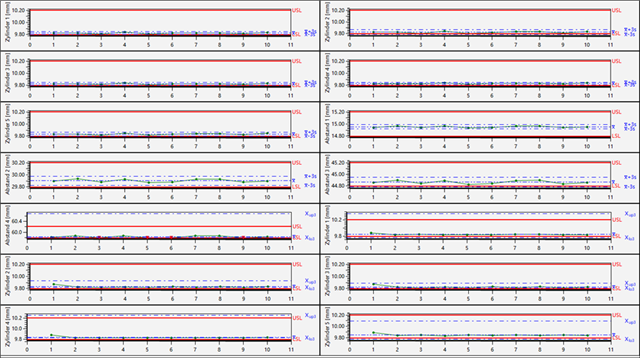
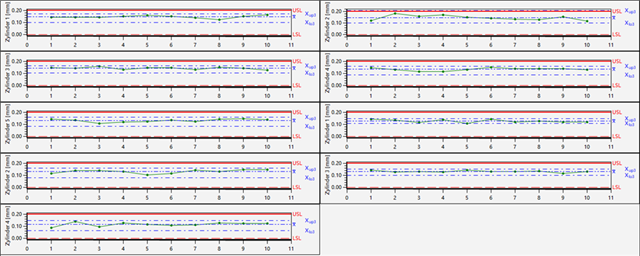
And yet: without much math, just looking at the graphics, you can see that all geometric features are well within the lower part of the specification..

All form and position tolerances are slightly increased, which was to be expected by the author..

But what does this mean?
Firstly, the author was very surprised that all geometric features were well below the tolerance center. This was despite the fact that the two machines were supposed to differ in price and therefore also in performance.
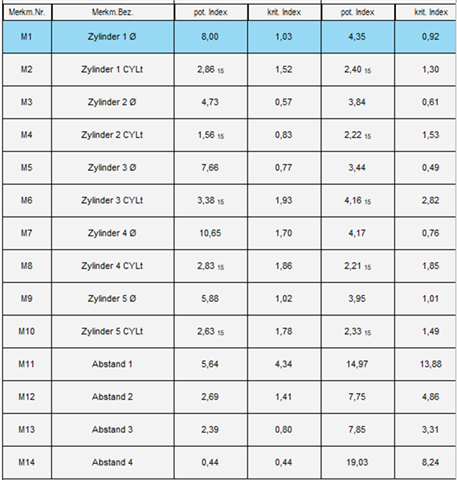
Even more interesting, however, was the mathematical comparison of the capabilities of the two 3D printers: on the left, the “simpler machine”; on the right, the “better machine.”

The characteristics can be roughly divided into cylinders and lengths (distances). And only in terms of distances, when producing smooth surfaces, is the expensive machine better. When it comes to cylinders, the cheaper machine sometimes even “wins.” A surprising result.
Resume
The main objective of the project was to understand the capabilities of the machines, also as material for future students. However, what the students achieved in addition to this was the most important thing for the author of this article.
A whole day was spent producing and measuring. Time was spent and materials were used. As mentioned at the beginning, the students were (deliberately) given very little information and simply told to work “according to the manual.” The same what happens in Industrie.
And what was found? That all average values are far too low... this could have been discovered after just three parts. In industry, there is a one-part prerun and a five-part prerun for this purpose. First, bring the first components into the tolerance center. Before spending money on complete machine capability.
Standard nozzles were used. After reviewing the measured data, the student also suggested repeating this work with different nozzles. Could the quality of the more expensive machine be related to the nozzles? Can better or worse results be achieved per machine per nozzle depending on the geometry?
And then the discussion turned to the “process parameters.” Nozzle, base material (filament), temperature, speed...
Here, follow-up work could possibly establish a test plan to evaluate this in a variance analysis or regression analysis, depending on the parameters, after the process parameters and target values have been defined in a full factorial test plan. The aim is to find the optimum for all process parameters.
However, this again depends on the desired quality. If the specification ranges had been +-0.4, then all the analyses would have been almost perfect.
And the end result would then be the thought process towards a running production process. Continuous production, with the recording of “environmental variables,” recording of measurement data, and an upcoming evaluation and correlation based on the environmental variables....
And here's just a small note from the author: Then components should be produced here that could still be used afterwards. Children's toys, chess pieces. The author's daughters have various ideas....
