Is the progression of the simulated forces smooth and the trend according to the engineering exceptions? Is the sum of all forces equal to 0 (are the absolute forces on upper and lower die the same)? How is the convergence behavior? See the convergence monitor and / or the status file? Is the mesh fine enough to capture the stress and strain gradients?
Is the simulated shape matching the engineering exception? Is the mesh suitable for the shape? How stable are the results if the mesh is modified?
Is the influence of different friction parameters in a reasonable range? Same for the heat transfer parameters?
What about the temperatures?
But these are all only simulation internal quality checks, which should be done, but which are not a real validation. You can and you should check the results with external references:
Take the yield strength of the material for a given temperature and strain rate matching the initial condition of the simulation. This may not be the yield strength on the data sheet (which is typically for room temperature and slow motion only), but the initial point of the relevant flow curve. Multiply it with the cross section of your specimen. The resulting force should be more or less equal to the initial force in the simulation. Note: This will not capture any errors made when collecting the material data.
Compare with experimental results.
Compare with literature.
Ask a forming expert to judge the results, they frequently have some rule of thumb to estimate the forces needed.
Ask a 2nd person to repeat your study (or some parts of it). Starting from the scratch with collecting the material data and potentially using an other software.
I did verify my model and it seems correct, may I know why there is a difference between the obtained flow stress strain curve vs the material database flow stress strain curve?
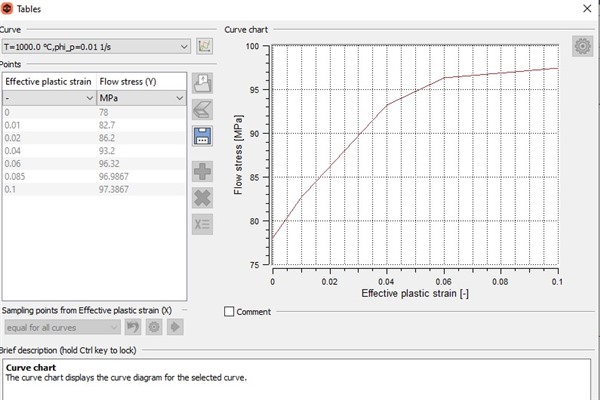
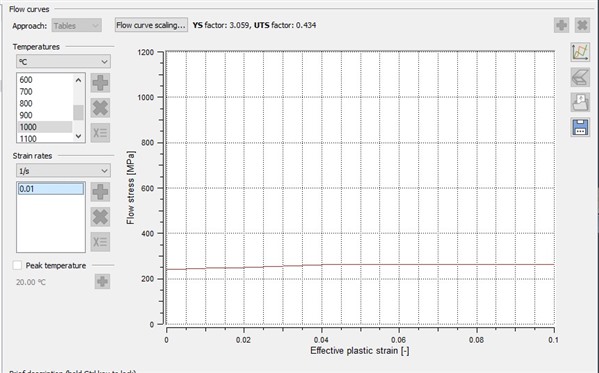
Also why are the curves different in global and individual ones in the database. the global shows a peak flow stress of close to 250 Mpa but not same in the individual table?
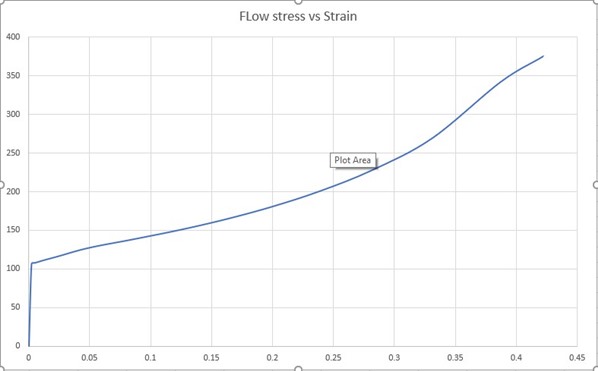
Please find the below plot of flow stress vs strain after doing the test in Simufact forging module, dies with no heat conduction and applied boundary conditions.
could you please confirm if my model is correct, or if am doing any mistakes please correct me .
your material uses very, very (much too high for the physics) scaling factors for the flow curve. The single curves are always unscaled as the individual tables are the "raw data". But the global curves are scaled. Because of this, you see this difference. The scaled curves are used for the simulation.
How did you generate the "flow stress vs strain" Excel plot from the simulation results?
If you have an experimental force deflection curve, I propose to compare this to the simulated force deflection curve. (deflection = stroke, but consider the measurement length in the experiment). In the experiment you always have the force deflection curve first. Form there you start to calculate stresses and strains, "engineering" and for the flow curve "true", smoothen, inter- and extraploate, ... and finally getting the flow curve to be used in the simulation. Now the simulation should give the experimental force deflection curve again.
In the simulation the local equivalent v. Mieses stress is less or equal to the flow curve in the material data used. (If no anisotropy, kinematic hardening or other specialties are used.) In friction free test simulations it is possible to get uniform stresses and strains with constant strain rates in the workpiece, which helps to verify this. But no need to do so, this is the math behind our simulation, can not be violated.
Thus if the flow curve in your material is above 200 MPa and your Excel chart starts with roughly 100 MPa, some thing does not match. May be just the temperature. But I can not see this from the information given.
I don't have a experimental data yet, for now I am trying to do a simple simulation in compression to match the acquired data with the given data in simufact
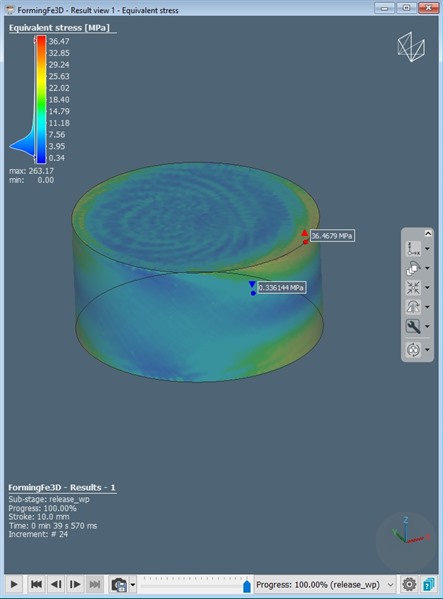
Equivalent stress.
.
Yes I calculated the true sress strain curve from the simulation load vs displacement results.
"given data in simufact" = material properties from the Simufact material data base?
"acquired data" = simulation results of the compression test?
Thus you are trying to close the loop and calculate backwards from the simulation results to the material data used as input? This is a reasonable approach for validation.
Please confirm before I answer in this direction. Thanks.
There are 2 approaches for this. The first one is purely testing the numeric:
Attached a simple compression model. It is friction free and without thermal effects (constant 1000°C in the example). This results into a uni-axial stress strain relation ship, which is simple to analyze. The press velocity is defined based on:
velocity = initial_height*phip*exp(-phip*time) with phip being the desired strain rate.
With this the strain rate remains constant through out the process. In the example 5 1/s.
Thus we have constant and uniform temperature and strain rate as well as uniform plastic strain and equivalent stress, with the equivalent stress being equal to the Z normal stress and to the contact pressure (in the simulation within the numerical accuracy of time and mesh discretisation and convergence reached).
In this condition the Effective Plastic Strain equals ln(current_height/initial_height). Let's just use absolute values for now. Measure the height in the results and compare with the simulation result --> validate.
As said, with the math we use ensures that the equivalent stress equals the flow stress of the material during plastic deformation. Take the Effective Plastic Strain from the results (or the calculation before), consider the temperature and the strain rate set in the model and compare the Equivalent Stress from the results. Compare with the flow curve in the material data --> validate.
The force on the dies (the press force) is contact_pressure*contact_area. With
you get the current press force as a function of the current stroke and the current contact pressure. The current contact pressure is already validated with the flow stress above and the plastic strain at the top. Compare the calculated fore using this formula and compare with the simulated force --> validate.