ODYSSEE Explore completes the ODYSSEE portfolio (ODYSSEE CAE, ODYSSEE A-EYE, ODYSSEE SOLVER) proposing data visualization and data mining charts that allows:
- To understand if the data is ready to be exploited by the Machine Learning software.
- To interpret the results with different visions.
Please note ODYSSEE Explore requires an ODYSSEE_Explore feature license for the GUI and an ODYSSEE_Solver feature license to run data exploration graphs with Quasar solver. ODYSSEE Explore does not embed its own Quasar executable in the setup. The user must already have installed ODYSSEE SOLVER, ODYSSEE CAE or ODYSSEE A-EYE.
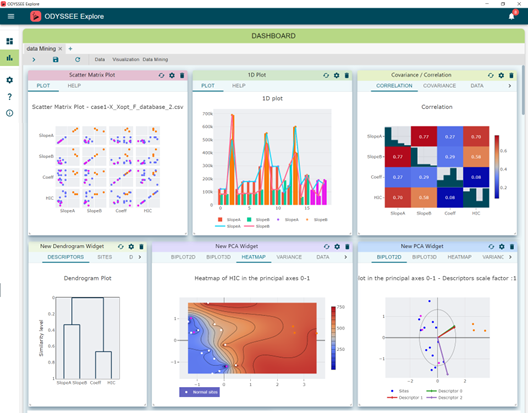 ODYSSEE Explore interface showing a dashboard: on the top left,
there is a scatter matrix view, on the top right there is the new view of the correlation matrix
What's New in ODYSSEE Explore 2024.2
- Data management has been revised: All data from a project is now available through structured organization with folders and csv files.
- No need to upload files anymore:
- Local files or folders on your machine that need to be used in the tool are selected by the user. This allows:
- To import in the tool complete folders or multiple selected files.
- To update data when source files has been modified.
- No limitation on file size.
- Labels are now handled by the tool. Symbols are authorized in these labels.
- Only CSV files accepted.
- Local files or folders on your machine that need to be used in the tool are selected by the user. This allows:
- In the interface, an automatic reload button allows to update plots and tables of the dashboards when data sources have been updated.
- History of previous odx project files is available in homepage.
- Data files from previous Explore versions should be reuploaded.
- Datasources and dashboards can be saved in projects.
- No need to upload files anymore:
- New visualization plots added:
- Distribution plot to visualize the density of data spread on the min-max range. Two options are available:
- KDE (Kernel density estimation) function corresponds to the kernel smoothing of a finite data sample (matrix X), which outputs a continuous probability density estimation at each output point.
- And/or histograms plot the horizontal axis is divided into sub-intervals or bins which cover the range of the data.
- User defines his bins number, but the default number is 0, that means the interval of bins is automatically computed based on some rules of thumb.
- 3D plot to visualize data in 3D. Color scale can be added as a fourth dimension.
- Distribution plot to visualize the density of data spread on the min-max range. Two options are available:
- In Table panel, a second and third tabs called Row Stat and Column Stat have been added to print the row and column statistics arrays computed on the matrix displayed in the first tab of the panel. The values displayed are min, max, Sum, position_min, position_max, sum, normL2, average, average_deviation, standard_deviation, variance, skewness, kurtosis
- Improvement:
-
- Access to the configurator of panels: The way to open the configurator part on the left side of the interface has been simplified, and it is now access by a simple click on the top-colored band of the panel instead of gear icon.
-
- Re-execute the settings: The icon to re-execute the settings defined in the configuration part has been replaced by a triangle icon in the top-band of the panels instead of gear icon to avoid confusion with the reload data option.
- Reload data: Spinning icon on the top strip of the application has been added to reload all dashboards with updated original files. In ODYSSEE Explore settings menu, a default timer is set to apply a check on the original files and send a message if any updates are found.
- Bugs fixed:
- Parallel plot:
- Legend was in scientific notation; It is now in standard notation.
- Labels were overlapped when the window was reduced. It is fixed and the labels can be now put in vertical orientation in Display menu from the config panel.
- For the correlation table and Kmeans plot in data mining, the first column of labels was considered in the correlation calculation. It is fixed.
- For 1D and 2D plots, the axis labels were missing.
- The cross filtering for Kmeans was not working. It is fixed.
- After a sleep mode, you were disconnected from the application and the following message was displayed “A websocket connection is disconnected”. It is fixed.
- If the user tried to point on a CSV file with a different delimiter than the one defines in settings, there was no display in DATA SOURCES. An error message has been added.
- For Kmeans, the seed number can now be editing manually.
- Parallel plot: