I had a couple questions currently my employer uses another software for laser scanning with a LLP but I am trying to explain to them since we use PCDMIS for the CMM we should also use it for the arm it would make everything more uniform measuring the same parts as far as reporting, alignments etc.. They seem to be hung up on the pretty color maps and 3d deviation points of polyworks or geomagic, i was wondering if any of you on here could enlighten me of some good looking reports with color maps, annotation points etc from a portable arm I can use as ammunition to get them to come around, i would really appreciate it even if its on the the hexagon block just something since i dont have the license for a portable arm to be able to show this.
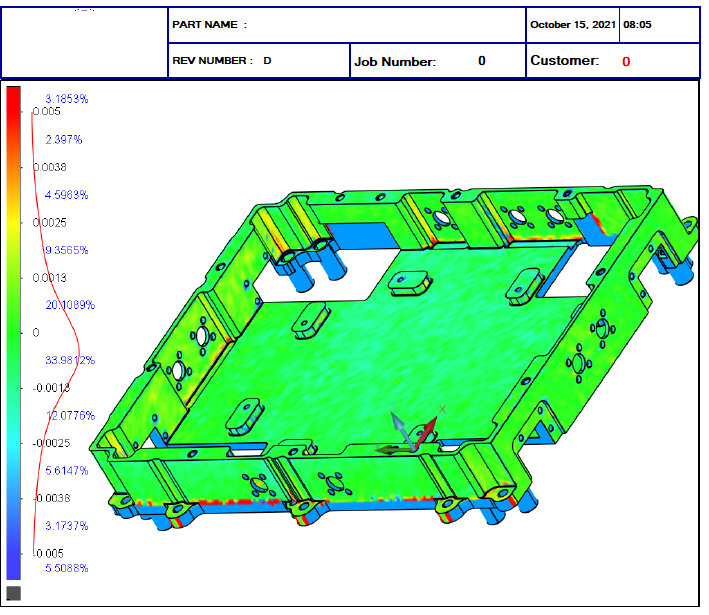
It's not a completed part that's why the blue on the bottom is the CAD model showing through. You can see the reddish yellow in the corners showing radii is a little big
I have the same issue!! even worst is that I use geometric features to AL. and they do BF in polyworks .results never will be 1:1. So I took their scan as STL.file imported into PC-DMIS and aligned it in Pointcloud/CAD Alignment. showed them and they still were unconvinced. can't teach an old engineer new tricks if it's set in its ways.
Or grab a scan create a COP1, then point cloud map it. create a surface color map.
So that photo in a report is really the only difference ? i was also wondering about annotations, or taking the T value of points on the scan data is that possible where pcdmis will just extract a vector that you dont have to probe and you can report the T value like you sort of would on the cmm? Also how do you clean noise/filter pointclouds when your using a romer arm just boolean?
So what do you mean by grabbing a scan and pointcloud mapping it, are you saying i could run the part on the cmm and at the end of the program import a pointcloud i took in another software on the faro arm and import it in the same alignment as the cmm ?
Kirbster no worries I appreciate it, are their any other things you can report, like if I had a COP could i report the dim info nom,dev,meas, on the annotations in the cop?
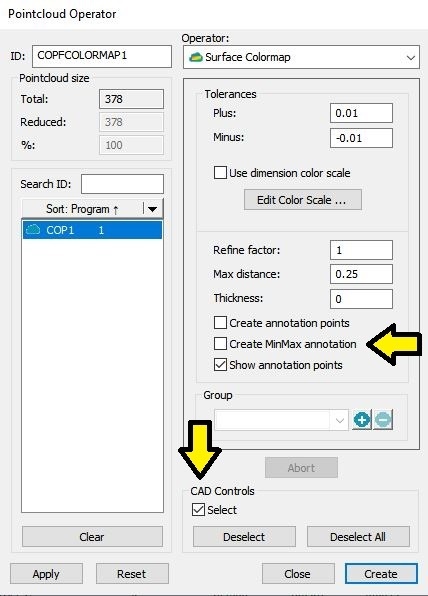
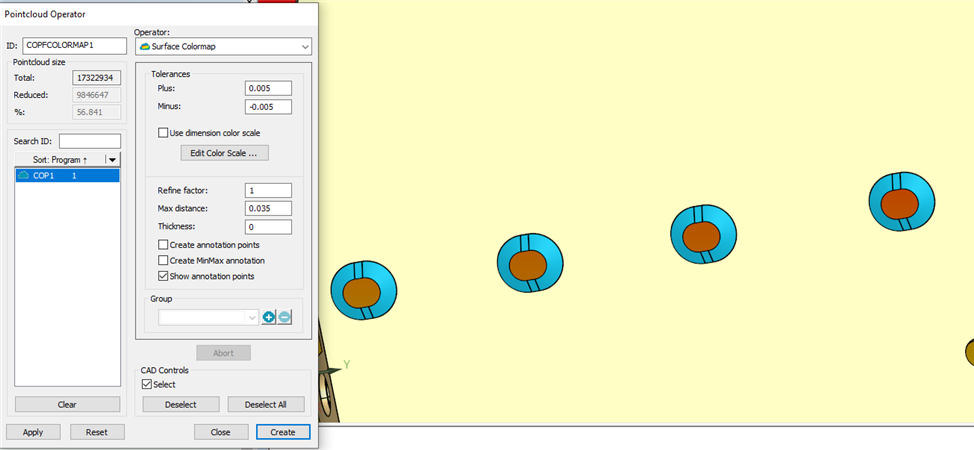
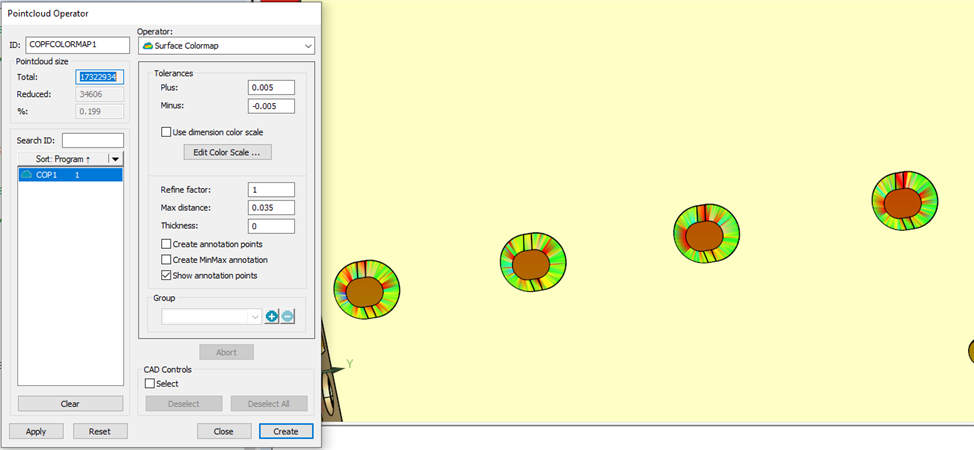
Now sometimes when I colormap the whole part and you notice maybe the countersinks turned up blue<<< not enough material, or red<<< to much material, so just want to show what's going on with the c'sinks. So you check Cad Controls, Click Select, choose your surfaces, my c'sink surfaces. and hit Apply
LOTS of things you can do in addition to the color map with a scan in Pcdmis Portable.
You can use AUTO FEATURES and select surface points to be pulled from the CAD data/SCAN data, uses the nominals from CAD data and reports the deviation, just like PCdmis on a CMM. You can then use DIMINFO to get the "T" (if that is all you want) deviation shown on the screen. For the CMM, you have no choice where to grab the measured values from, but with Portable, you have the option of the measured data coming from the COP. I've only played with it a time or two, mostly because the POS laptop we have will crash Pcdmis randomly while scanning, so trying to cycle multiple parts through sucks real bad as you can't save part way through.
There is also an option to have it show the vector deviation of EVERY point in the scan, but that is insane as you have to be zoomed is so tight to be able to see individual deviation values that it is all but useless.