Q-DAS was founded more than three decades ago. The basic idea was to relieve the user of the complex mathematics involved in calculating capability indices. Thus the heart of the software was created. The evaluation strategy!
Machine and process capability analysis

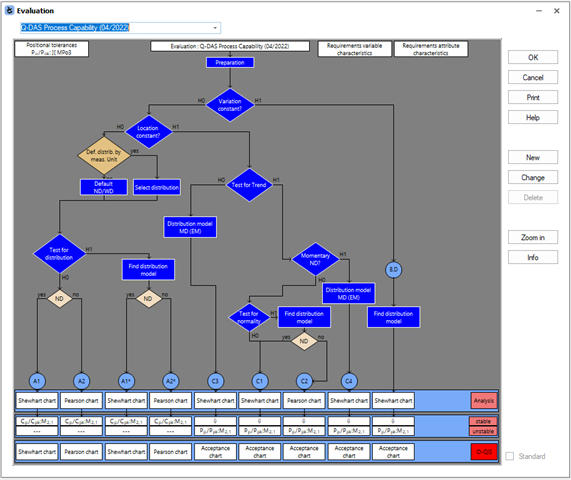
The target was, and is, to perform a fully automated calculation according to the rules of the standards or the company's own guidelines. Without the user of the software having to master this mathematics.
Everyone should be able to work with the results!
No one should work to get results!
Following this principle, the evaluation strategy was built up over the years to automate the search for the time distribution model, the distribution form selected with it, the calculation of the most diverse capability indices as well as the predefinition of the quality control charts possible for it. This made it possible for everyone to achieve a statistic evaluation according to the rules of their company, even without much training.
The decisive advantage this brought was the reproducibility of the evaluation. Reliable statistics that could be repeated at any time with the same strategy and the same data pool, and did not change on the basis of a user decision with each evaluation.
Measurement System Analysis
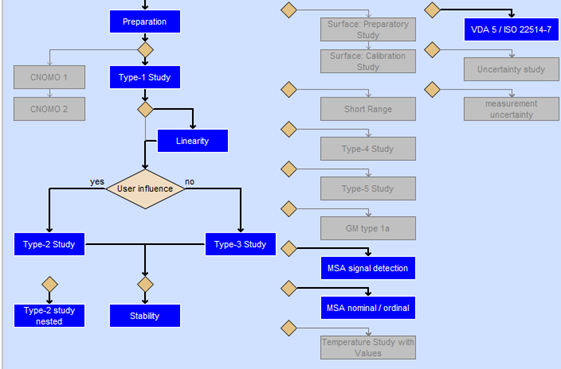
The second building block on which the entire Q-DAS system rests is the Measurement system analysis. Now on the market as the artificial name solara.MP, it includes the possibilities of MSA according to 2nd. 3rd and 4th edition, the uncertainty calculation according to VDA5 (up to edition 3), as well as the GUM. Here, too, the target was to define the basic mathematical rules by means of an evaluation strategy and to enable the user to carry out an automated evaluation.

The interpretations of the MSA or VDA5 are laid down by the company in a strategy, thus creating the same system as in qs-STAT. Reproducible and reliable evaluations.
Various evaluation options in qs-STAT
While at the beginning of the software only the classic capability indices Cp/Cpk could be calculated (even then, however, according to standards that are still valid today), over the years there have been massive developments and requests by the various branches of industry.
Besides the characteristic values (which many other companies also claim they can calculate), the evaluation of classical characteristics alone has become a wide spectrum of output points of "capabilities". To name just a few:
-
Process capability
-
Process performance
-
Intrinsic capability
-
process alignment index
-
Capability index from z values
-
AIAG demand Pp/Cp
In addition, all calculation variants that had been applied in the industrial sectors
-
Percentile method
-
Range method
-
Excess share method
-
Calculation with extended limits
-
CNOMO
-
AFNOR
-
Taguchi
Other output points
Over the years, more and more outputs have been developed in addition to the classic capability indices or the well-known characteristic values such as average / median / standard deviation / ranges. In the language of the software, these are simply called "output points". These would be as an example:
-
Tolerance utilisations
-
Outputs from further mathematical tests
-
QCC - Parameters
-
Quantiles
-
Special output points for part evaluations
-
Combination fields
-
Database information fields
-
And many more
Over the decades, the list of issues has grown to such an extent that there can no longer be a handbook. Writing one would be a never-ending task. (Therefore, the individual documents on a topic describe the corresponding output points).
Other feature types
While at the beginning there were classic variable characteristics, over time many different types of characteristics were implemented following the standards.
-
Attributive characteristics (defective units)
-
Error collection cards (errors per unit)
-
2D positional tolerances
-
3D positional tolerances
-
Ordinal characteristics
-
Nominal characteristics
-
Other multivariate characteristics groups: Unbalance, concentricity, coaxiality, perpendicularity
Depending on the feature type, with own evaluation options and graphics
Graphics in the software
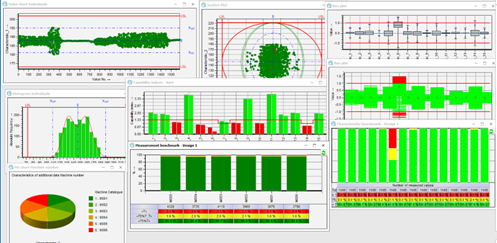
The core of the software are the informative graphics. Hundreds of graphics, each of which can be individually adapted to the requirements, show the mathematical evaluations simultaneously, from the evaluation of individual characteristics and the examination of parts to an overview of many loaded test plans.

In combination with the form designer, which can be used to create individual reports in addition to the standard reports supplied, this represents the core of the software for the user, who can thus quickly obtain the information he needs.
Further evaluation methods
Particularly in the area of machine capability, in addition to the classic Cm/Cmk ; Pm/Pmk analyses, there are also analysis methods from the global markets:
-
1-Part - Prerun
-
5-Part - Prerun
-
Tool Change - Analysis
-
PAA - Part Anomaly Analysis
-
TNC
Data Format
A milestone in the history of Q-DAS was the "invention" of the Q-DAS ASCII transfer format. After several attempts at the time of the DOS version, the Q-DAS ASCII transfer format was defined during the time of the 16-bit version. A universal format with coded information on the level (part / characteristic / measured value), independent of languages through the use of so-called "K-fields". This "quasi-standard" has become accepted in the industry as SPC data exchange format, a working group of the automotive industry at that time (AQDEF) has raised it to a standard and demands it from every measuring device manufacturer. Since non-automotive members now also participate in the AQDEF, the name was changed to "Advanced Quality Data Exchange Format". A forthcoming ISO standard will define this format as "SPC Data Exchange Format”
O-QIS
The beginning of the O-QIS product was the "procella" module. In its early days it was known as "procella monitoring". The target was to make the data recording, which provides the measured values used for the calculation of the capability indices, under exactly the mathematical aspects. Following the basic idea of SPC!
Many co-vendors in the market claim to offer an SPC system for data recording. But by starting out 30 years ago with capability calculation, Q-DAS software has a unique selling point in the market as far as the application of "SPC" is concerned.
Procella was developed for manual data recording. The user is guided through the measuring task with graphic support. Data is acquired manually via the keyboard or via the serial interface.
With the start of the 32-bit version, MCA/CMM Reporting was launched. With this, the measurement protocols written by measuring machines are loaded, visualised to the user, together with the available historical data. And alerted if necessary.
With the Monitoring module, a tool has been created for visualising rapidly changing process parameters, where the views are refreshed every second in order to see the development of the process parameters.
The modules of the O-QIS were rounded off by the last product for the Shopflor, the Alarm Manager, with which the alarms that occurred at the individual data collection stations can be visualised.
All data acquisition products in the O-QIS have one thing in common: It is not reduced to the sole statement of alerting measured values (OK/NOK). In interaction with the qs-STAT, the SPC alarms are also taken into account in order to prevent tolerance violations from occurring in the first place through the application of SPC.
M-QIS
With the reporting system, the core of the M-QIS product, the evaluation can be automated with qs-STAT. Set up on the server, the data is automatically loaded according to defined rules, the reports are created, sent by e-mail or filed, in order to automate the lion's share of evaluations.
In addition, data compression can be carried out for the long term analysis module in order to save the calculated results per time unit and thus to get a quick view of the temporal course of the evaluations.
Other core products
The Q-DAS Suite is completed by a large number of other products that have been created over the years to cover the various needs and requirements.
Q-EMPB: the Initial Sample Report. Whether PPAP, QS-900 or the requirements according to VDA Volume 2
Together with qs-STAT and solara.MP, the Q-EMPB is the third product that every manufacturing company needs. All manufacturing companies have to carry out initial sampling, have to qualify their measuring devices, have to qualify their processes, and need support for this with suitable software. Thus, these 3 represent the absolute core of the software.
vidara / destra: SixSigma tools for analysis of variance, regression analysis, DoE and reliability analysis. Initially developed as classical modules, they are now included in a package with its own data structure, which provides the SixSigma engineer with a comprehensive overview during his work.
Browser based products
At some point, the new world came. Browser-based. Prepared for the cloud. A colourful world. First with the pure web products "Real Time Monitoring" and "Plant Viewer", then followed the classic products qs-STAT and solara.MP browser-based. Not as a replacement for the desktop version, but to complete the portfolio. For users who simply need to read and evaluate.
Interaction
The products all work together. The core of the installation is the central database, the core of the software is the central evaluation strategy. Desktop versions and browser-based have the same core. The key user sets everything in the desktop application, the browser-based products react to it. With the web product, users who only ever load data to view evaluations can be quickly given a login without installation on the local client.
qs-STAT and O-QIS work together in SPC. The rules are defined in qs-STAT and used in O-QIS. Thus, at the O-QIS station in the measuring room or directly in production, no in-depth knowledge of the statistics and rules of the quality control charts is necessary.
The Future
The future is wide open. The target is more and more automation. Web interfaces, Rest API, integration of the evaluation into other products.
No matter how, it is basically only a matter of distributing the information, evaluations, alarms or results obtained by the Q-DAS products, making them accessible to users and other systems. It is the technology that will change fundamentally. The core of the software will remain.
