We are opening the "solara.MP" software. When I gave the training session on this, I'm sure more than half of my colleagues and partners around the world thought: "Now he's losing his mind". We wanted to talk about SPC, didn't we? Quality control charts and all that...
And yes, Mr Gastgeb opens solara.MP first. And for good reason...
At some point, at the end of the process for "SPC", we then have a "message" from a control chart or a value curve. A so-called "alarm". The work to be done in the Q-DAS software is simple: select event, measure, cause. Technically, a report may be printed and an email sent. For the worker, however, this means that they have to take action. Possibly intervene in the process. Rules. Or even just analyse. No matter what, every alarm means effort.
And now you have to think about WHY you are now making work for the user of the software. And the beginning lies in checking the "capability of the measuring devices". Whether this is the MSA or the VDA5 plays little role at first. But if the measuring equipment is not suitable for these tasks, no SPC process should be started.
And you should illustrate this in your own example with your own data.
Take a known process that is to be regulated later. For this, there will be an MSA, a Type-1 Study and Type-2 Study, as well as the actual value chart later.
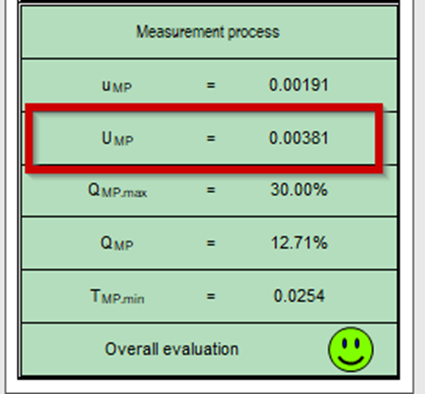
With solara.MP and a VDA5 strategy, an uncertainty according to model 4 (pure MSA data) is simply carried out. The result is a measurement uncertainty UMP

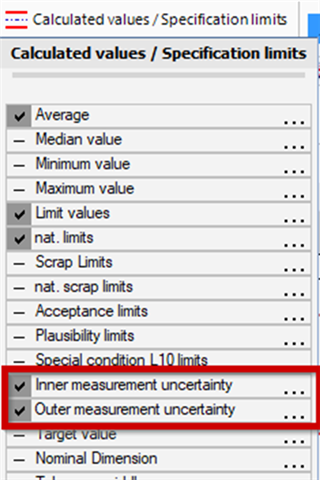
In the process analysis, this value is entered for the characteristic in the expanded measurement uncertainty (K2640)

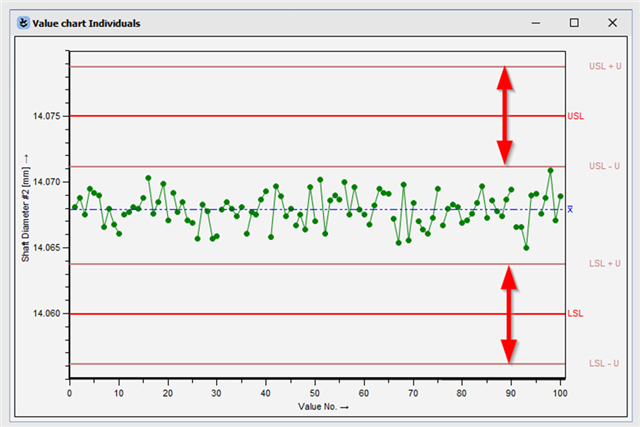
We can now display this "uncertainty range" around the specification limits in the value chart:

This may be a fictitious example. Unfortunately, it is often similar to the customer's view. If a measured value is within the range marked here, it is no longer possible to say exactly whether the measured value was within or outside the specification limit:

Although this affects the individual values, the QCC parameters (average and variation) are of course also dependent on this. The larger the uncertainty range is in percentage terms, the larger the sample size would have to be in order for the central position (Variation) to be checked in a meaningful way, but this would then lead to a large variation in the subgroup, which would result in nonsensical alarms in the variation charts...
In short: Uncertainty too high? First take care of the measurement process!
Side note:
The analysis briefly shown above is carried out on a massive scale for many customers. The average measurement uncertainty across all measurement processes is then checked.
What is then determined is then used for the individual values alarm in the strategy or the online alarm conditions for the alarm limit, where the Q-DAS strategy assumes an ideal world with only 10% around the specification limits.

