A little historical excursion: The German word for "subgroup" is "Stab - Test" (Stich-Probe). And the Author likes this historical explanation most (if it is real or not)
When "Germany" was still divided into small kingdoms and principalities, there were customs limits. Straw and hay were duty-free. There were sentries at the limits, and they used their halberds to "stab" the straw being transported to check whether anything was hidden in it. The larger the wagon load, the more often they would "stab" it to check whether anything was hidden under the straw.
Little has changed in this basic idea so far.
The fact of "how often" a subgroup should be taken and measured is the sole responsibility of the customer. However, this must be taken into account: Between 2 subgroups there are a number of components that have not been measured. Now a problem is detected in the next subgroup. The subgroup provides "information" about the population. Meaning: a decision must be made on what to do with the components that have NOT been measured since the last subgroup. So if the frequency is too small, components that have not been measured and could have a problem may already have been delivered.
The size of the subgroup itself is the other issue. How do you plan this?
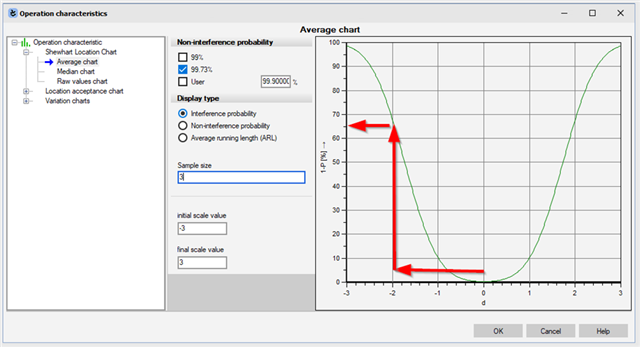
The Q-DAS software provides the "operation characteristics" for this purpose. A detailed description is available:
Link to OC
To briefly explain the graph: the parameter "d" means a significant jump in the target by "one times the standard deviations of the process". A classic Shewhart average chart with a subgroup size of 3 can therefore only detect a significant change in the process by 2 times the standard deviations with a probability of 65%.

Graphically explained: With a subgroup size of 3, there would be a 65% probability of "detecting" a significant average change of 2s.

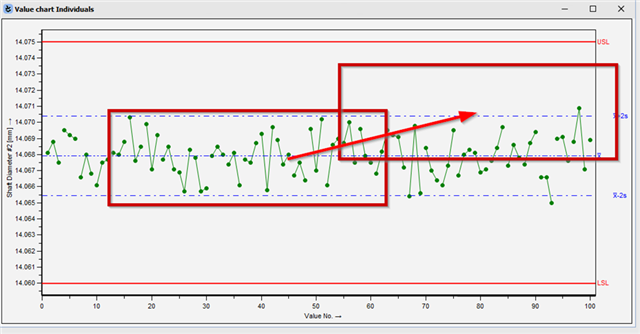
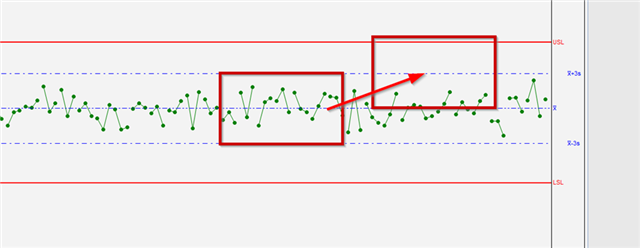
If you wanted 100%, you would only notice this jump:

The pictures should speak for themselves...
