This is not a "How To" on what you need to do as a user. This is a "How To" and to explain why this software exists. To automatically find suitable distributions. And this is not to go deep into the maths, but to explain the idea.
Why are we looking for best-fitting distributions?
We have to travel back in time. More than 200 years. The normal distribution was used, Mr Gauss put a lot of work into it and started calculating things. This form of distribution was so famous that it was even depicted on the 10 DM banknote (the currency of the Federal Republic of Germany at the time):
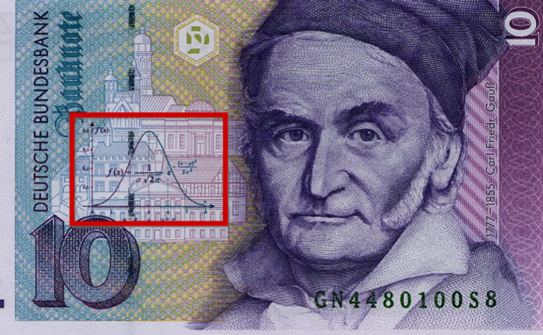
(Image source : Wikipedia)
And as access to personal computers was quite difficult for mathematicians at the time, they were happy to use binomial distribution and normal distribution.
At the beginning of the last century, still 100 years ago, a mathematician named Walter A. Shewhart, whose quality control charts are known to anyone who is even half-heartedly familiar with this industry, used the same mathematics. And he found the following in his analyses, as my dear colleague and master black belt so aptly described in a blog:
“An attempt was made to apply the normal law to many observed distributions, but it was soon found to be unsatisfactory in a majority of problems. This situation gave rise to an active search for more general laws, ...”
That was in the year of our Lord 1931!
Well, let's move on to the present day. Somehow, a large part of the world seems to have remained at the level of knowledge that existed BEFORE 1931. Because unconditionally and without any effort to think about it, the normal distribution is superimposed on everything and used in formulae. The whole thing is "excused" by the guilty parties with the remark that it is a "basic calculation". You can't really get more "wrong" than that.
Anyone who claims that a so-called "basic calculation would be sufficient for the customer" is lying and will provide the customer with incorrect results on the basis of which wrong decisions are then made. And there are a handful of software packages that could calculate correctly. The advantage of the Q-DAS software is the automation, so that a simple user does not need to be mathematically trained.
The author himself had a good professor when studying mechanical engineering. He also taught us the normal distribution, how to calculate with huge nomograms, and essentially trained us in this form of distribution. But even back then he always told us: "That's usually not true! I'll teach you the basics! Understanding what a "distribution" is! But using the normal distribution must first be considered wrong! Use computers, they can do it better."
I didn't know Q-DAS back then. Only 5 years later. But when I looked at the software, I remembered my studies and immediately understood the purpose of the software. Because this is the heart of the Q-DAS software. This is the reason, why I am working at Q-DAS.
Now, what does the software do to find a suitable distribution? (Suitable! To describe the process in the best possible way. Not to calculate the most beautiful capability values)
We follow the ISO and customer requirements in the following sequence: First, we check the stability of the characteristic.
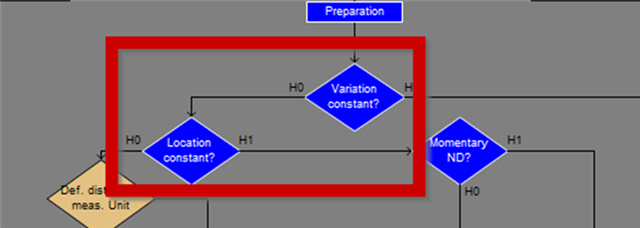
These tests can be used to make the first distinction. Can distribution models be used that utilise pure "single-peaked" distributions?
If these two tests confirm this, then yes. Because then we are in the process models A1 and A2, which can use the normal distribution (A1) or other single-peaked distributions (A2)
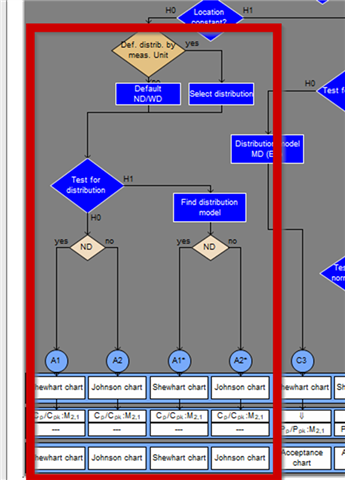
This area is also the one that is available in the machine capability. There is a specification of defined desired distributions. Either purely based on the specification limits (normal limits or natural limits), or a special specification based on the selected measured variable. (25 years ago, a large company analysed various measured variables and drew up a list of the single-peaked distribution form that these processes could usually follow. Could!)
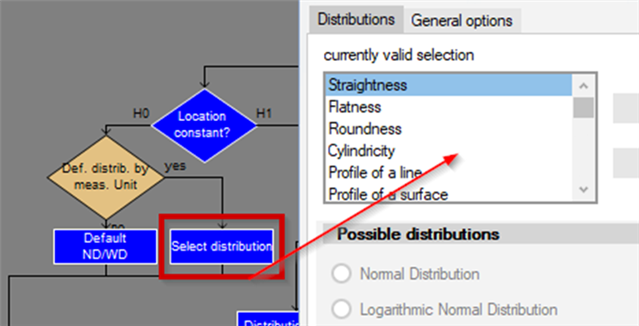
None of these distributions are used just like that. Each specification is tested; there are tests described in standards for the distributions, which must be carried out before a distribution can be used in this way. If the desired distribution is rejected, a best-fit distribution is selected from a defined list of one-point distributions. Most commonly used is the search for the best regression coefficients.
But what happens if location and/or variation are not constant?
Depending on whether it is location or location and variation, we run into the process time models B, C or D:
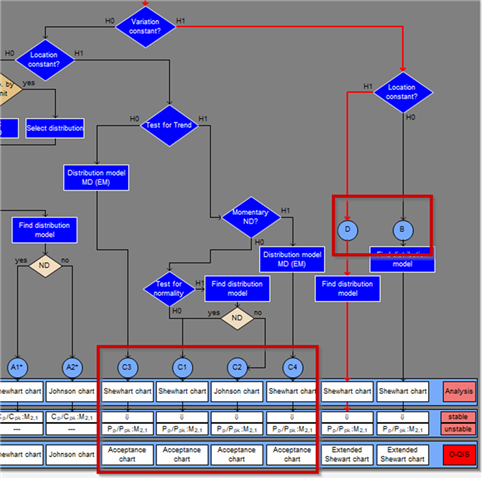
And now, there is a wide range of possibilities!. Mixed distribution , Mixed distribution with a defined amount of moments/cores, Normal distribution extended, and more extended for the C3 and C4 path, Person-calculation…
And in SOME of this path, also again one-point distribution. Why? Because when everything is unstable, maybe the amount of data, the total sum is again a “one-pointed distribution”.
The definition “which one in which path” would be a workshop. A definition done by the company. In a workshop we can show you the different possibilities, we are also allowed to explain what companies are doing since years, who defined their own strategies to be delivered with the Software as a standard.
