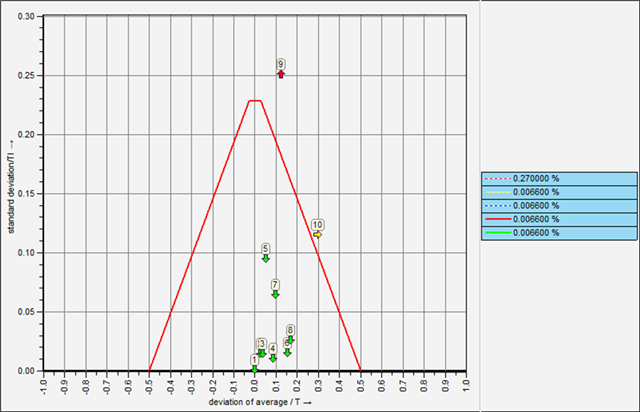
The TNC calculations come from the French market. Although these may not yet be widely used internationally, the author would like to explain them, as these considerations can also provide a good overview.
The basic idea is the same as for the 5-Part-PreRun. Get an overview of the location of the various characteristics with just a few measured values.
The calculation takes place with just 3 measured values. The standard deviations in relation to the tolerance are plotted against the mean deviation in relation to the tolerance for each characteristic.

The "truncated pyramid" drawn in the graphic shows the maximum permitted proportion outside specification. And the basic idea is similar to the C values. The smaller the variation, the more the location could fluctuate.
The maximum proportion outside specification is defined in the evaluation strategy.
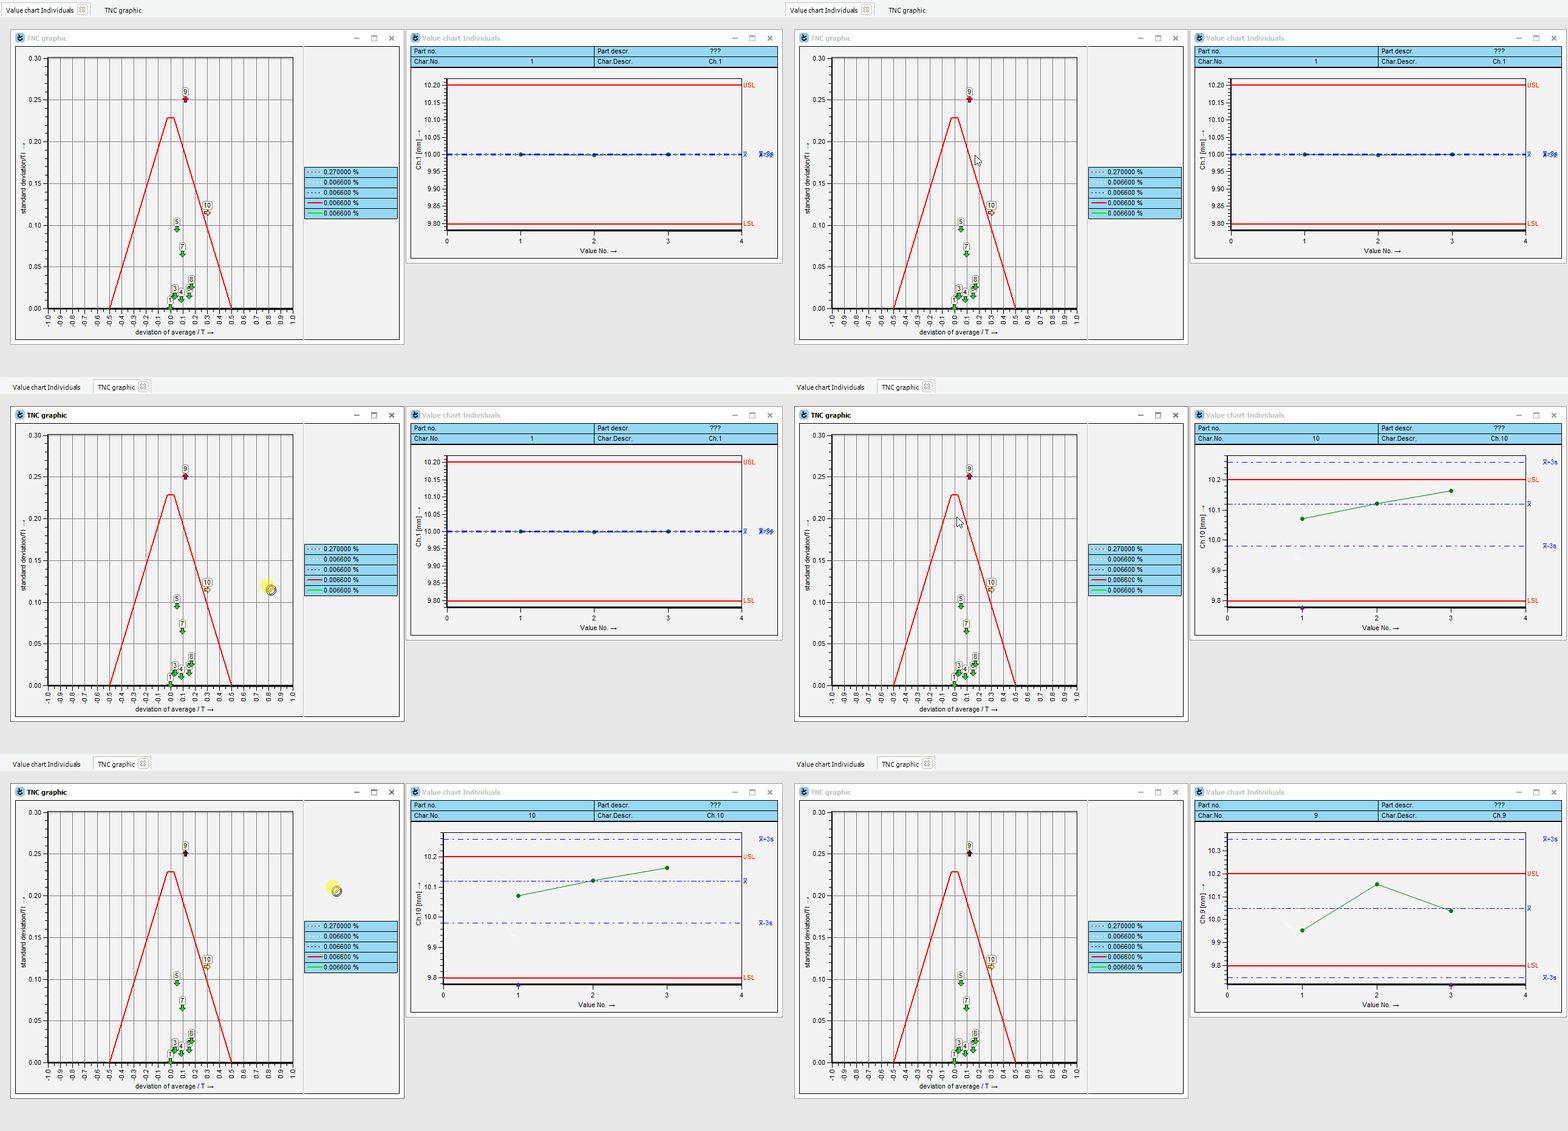
As with all summary graphics, an affected characteristic (in this case characteristic 9 as an example) can be held down with the mouse and dragged onto an Individual characteristics graphics to see the deviating characteristic directly. This means that even with a very large data pool, an affected characteristic can be viewed quickly.

