Every once in a while, a question reaches hotline about inconsistency of results from effectiveness study according to AIAG MSA. The original problem seems to be that results in Q-DAS and results in MSA table are different. We would like to shed some light onto this problem.
Let’s start with how the data are defined in the MSA:
|
Part |
A-1 |
A-2 |
A-3 |
B-1 |
B-2 |
B-3 |
C-1 |
C-2 |
C-3 |
Reference |
Measurement |
|
1 |
1 |
1 |
1 |
1 |
1 |
1 |
1 |
1 |
1 |
1 |
0.476901 |
|
2 |
1 |
1 |
1 |
1 |
1 |
1 |
1 |
1 |
1 |
1 |
0.509015 |
|
3 |
0 |
0 |
0 |
0 |
0 |
0 |
0 |
0 |
0 |
0 |
0.576459 |
|
4 |
0 |
0 |
0 |
0 |
0 |
0 |
0 |
0 |
0 |
0 |
0.566152 |
|
5 |
0 |
0 |
0 |
0 |
0 |
0 |
0 |
0 |
0 |
0 |
0.570360 |
|
6 |
1 |
1 |
0 |
1 |
1 |
0 |
1 |
0 |
0 |
1 |
0.544951 |
|
7 |
1 |
1 |
1 |
1 |
1 |
1 |
1 |
0 |
1 |
1 |
0.465454 |
|
8 |
1 |
1 |
1 |
1 |
1 |
1 |
1 |
1 |
1 |
1 |
0.502295 |
|
9 |
0 |
0 |
0 |
0 |
0 |
0 |
0 |
0 |
0 |
0 |
0.437817 |
|
10 |
1 |
1 |
1 |
1 |
1 |
1 |
1 |
1 |
1 |
1 |
0.515573 |
|
11 |
1 |
1 |
1 |
1 |
1 |
1 |
1 |
1 |
1 |
1 |
0.488905 |
|
12 |
0 |
0 |
0 |
0 |
0 |
0 |
0 |
1 |
0 |
0 |
0.559918 |
|
13 |
1 |
1 |
1 |
1 |
1 |
1 |
1 |
1 |
1 |
1 |
0.542704 |
|
14 |
1 |
1 |
0 |
1 |
1 |
1 |
1 |
0 |
0 |
1 |
0.454518 |
|
15 |
1 |
1 |
1 |
1 |
1 |
1 |
1 |
1 |
1 |
1 |
0.517377 |
|
16 |
1 |
1 |
1 |
1 |
1 |
1 |
1 |
1 |
1 |
1 |
0.531939 |
|
17 |
1 |
1 |
1 |
1 |
1 |
1 |
1 |
1 |
1 |
1 |
0.519694 |
|
18 |
1 |
1 |
1 |
1 |
1 |
1 |
1 |
1 |
1 |
1 |
0.484167 |
|
19 |
1 |
1 |
1 |
1 |
1 |
1 |
1 |
1 |
1 |
1 |
0.520496 |
|
20 |
1 |
1 |
1 |
1 |
1 |
1 |
1 |
1 |
1 |
1 |
0.477236 |
|
21 |
1 |
1 |
0 |
1 |
0 |
1 |
0 |
1 |
0 |
1 |
0.452310 |
|
22 |
0 |
0 |
1 |
0 |
1 |
0 |
1 |
1 |
0 |
0 |
0.545604 |
|
23 |
1 |
1 |
1 |
1 |
1 |
1 |
1 |
1 |
1 |
1 |
0.529065 |
|
24 |
1 |
1 |
1 |
1 |
1 |
1 |
1 |
1 |
1 |
1 |
0.514192 |
|
25 |
0 |
0 |
0 |
0 |
0 |
0 |
0 |
0 |
0 |
0 |
0.599581 |
|
26 |
0 |
1 |
0 |
0 |
0 |
0 |
0 |
0 |
1 |
0 |
0.547204 |
|
27 |
1 |
1 |
1 |
1 |
1 |
1 |
1 |
1 |
1 |
1 |
0.502436 |
|
28 |
1 |
1 |
1 |
1 |
1 |
1 |
1 |
1 |
1 |
1 |
0.521642 |
|
29 |
1 |
1 |
1 |
1 |
1 |
1 |
1 |
1 |
1 |
1 |
0.523754 |
|
30 |
0 |
0 |
0 |
0 |
0 |
1 |
0 |
0 |
0 |
0 |
0.561457 |
|
31 |
1 |
1 |
1 |
1 |
1 |
1 |
1 |
1 |
1 |
1 |
0.503091 |
|
32 |
1 |
1 |
1 |
1 |
1 |
1 |
1 |
1 |
1 |
1 |
0.505850 |
|
33 |
1 |
1 |
1 |
1 |
1 |
1 |
1 |
1 |
1 |
1 |
0.487613 |
|
34 |
0 |
0 |
1 |
0 |
0 |
1 |
0 |
1 |
1 |
0 |
0.449696 |
|
35 |
1 |
1 |
1 |
1 |
1 |
1 |
1 |
1 |
1 |
1 |
0.498698 |
|
36 |
1 |
1 |
0 |
1 |
1 |
1 |
1 |
0 |
1 |
1 |
0.543077 |
|
37 |
0 |
0 |
0 |
0 |
0 |
0 |
0 |
0 |
0 |
0 |
0.409238 |
|
38 |
1 |
1 |
1 |
1 |
1 |
1 |
1 |
1 |
1 |
1 |
0.488184 |
|
39 |
0 |
0 |
0 |
0 |
0 |
0 |
0 |
0 |
0 |
0 |
0.427687 |
|
40 |
1 |
1 |
1 |
1 |
1 |
1 |
1 |
1 |
1 |
1 |
0.501132 |
|
41 |
1 |
1 |
1 |
1 |
1 |
1 |
1 |
1 |
1 |
1 |
0.513779 |
|
42 |
0 |
0 |
0 |
0 |
0 |
0 |
0 |
0 |
0 |
0 |
0.566575 |
|
43 |
1 |
0 |
1 |
1 |
1 |
1 |
1 |
1 |
0 |
1 |
0.462410 |
|
44 |
1 |
1 |
1 |
1 |
1 |
1 |
1 |
1 |
1 |
1 |
0.470832 |
|
45 |
0 |
0 |
0 |
0 |
0 |
0 |
0 |
0 |
0 |
0 |
0.412453 |
|
46 |
1 |
1 |
1 |
1 |
1 |
1 |
1 |
1 |
1 |
1 |
0.493441 |
|
47 |
1 |
1 |
1 |
1 |
1 |
1 |
1 |
1 |
1 |
1 |
0.486379 |
|
48 |
0 |
0 |
0 |
0 |
0 |
0 |
0 |
0 |
0 |
0 |
0.587893 |
|
49 |
1 |
1 |
1 |
1 |
1 |
1 |
1 |
1 |
1 |
1 |
0.483803 |
|
50 |
0 |
0 |
0 |
0 |
0 |
0 |
0 |
0 |
0 |
0 |
0.446697 |
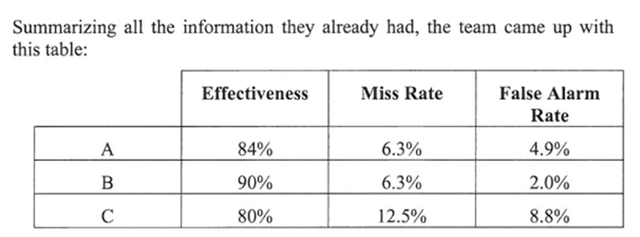
In this table we can see the operator’s decisions, the reference (is the assessed part OK or NOK) and an actual measured value of the part.
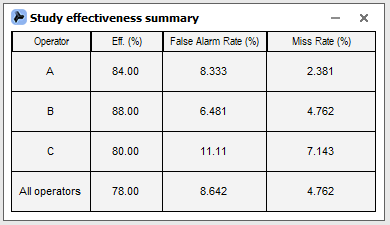
If we adopt the table in the solara.MP effectiveness study without an actual measured value, but only with the reference, the result will be exactly the same as in the MSA standard.
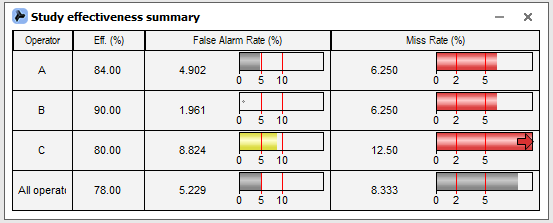
But if we take care about what is written in the actual measured value?
The result then in the solara.MP is not the same as in MSA standard.
And the reason is simple. Tolerance limits for this process are LSL=0.45 and USL=0.55
Let’s take a look at the table at the values 22 and 26.
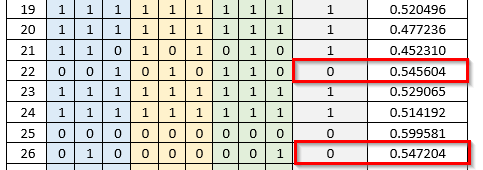
Both values are assessed as NOK in this table. But actual measured value is in the specification limit, and therefore, we asses it as OK. We consider this “confusing” at best, if not downright wrong. And this is the reason why sometimes there seems to be a difference in the results from the MSA table and solara.MP results.