With changes in the VDA 5 we introduced some new functions in version 2024.2. One of the new functions is an output point that helps the users to identify what is wrong in the procedure or design of the study.
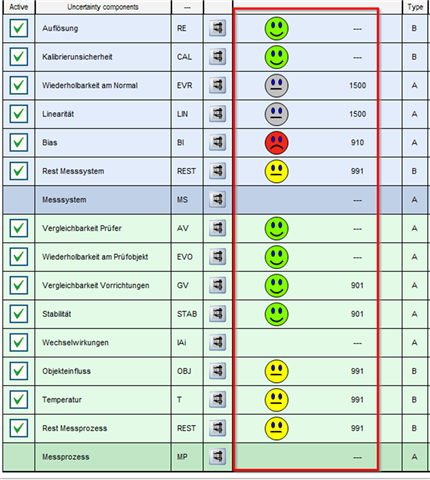
The smiley in green, yellow, red and gray is not an indication of a good or bad rating. It indicates whether an influence component has been defined correctly or whether data has been entered at all.
Here is the legend:
- Green – Everything is filled out correctly and in use
- Green with a specific code – If basic data were available, the component could be used, but there is no data.
- Yellow – The influence component is selected, but no data has been entered. The user should therefore either deselect or enter the required data.
- Red – The calculation is done, but only with part of the data. It waits for more data to be filled out. For example, when Bias is calculated from one standard, but it expects more standards based on selected settings (ANOVA).
- Grey – Mathematically impossible to calculate. For example, Linearity in the case where ANOVA was selected but only 1 standard is recorded.
The influence components in the measuring system are interdependent. In the example above, the mathematical definition of the influence component of repeatability on the standard was set to “ANOVA”, but only one standard was selected. the linearity cannot be evaluated (gray), and the bias is waiting for further standards (red). A correction of the influence component “repeatability at the standard” directly solves the problems with linearity and bias.
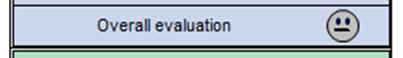
Please note that no overall rating is given if there are problems in the design or in the execution of the study. This applies to influencing components that are grayed out, i.e. there is a mathematical problem, and also to influencing components that are yellowed out, i.e. no information has been provided.
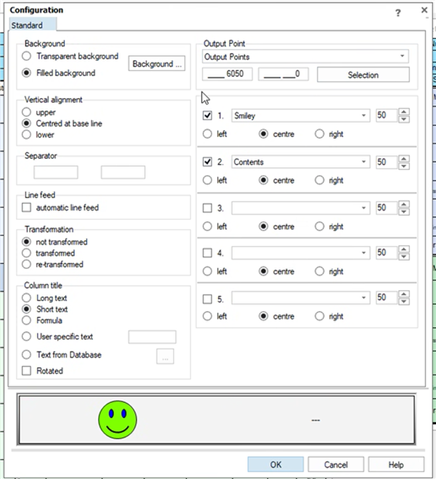
To activate the output point, the new column must be added to the budget table: