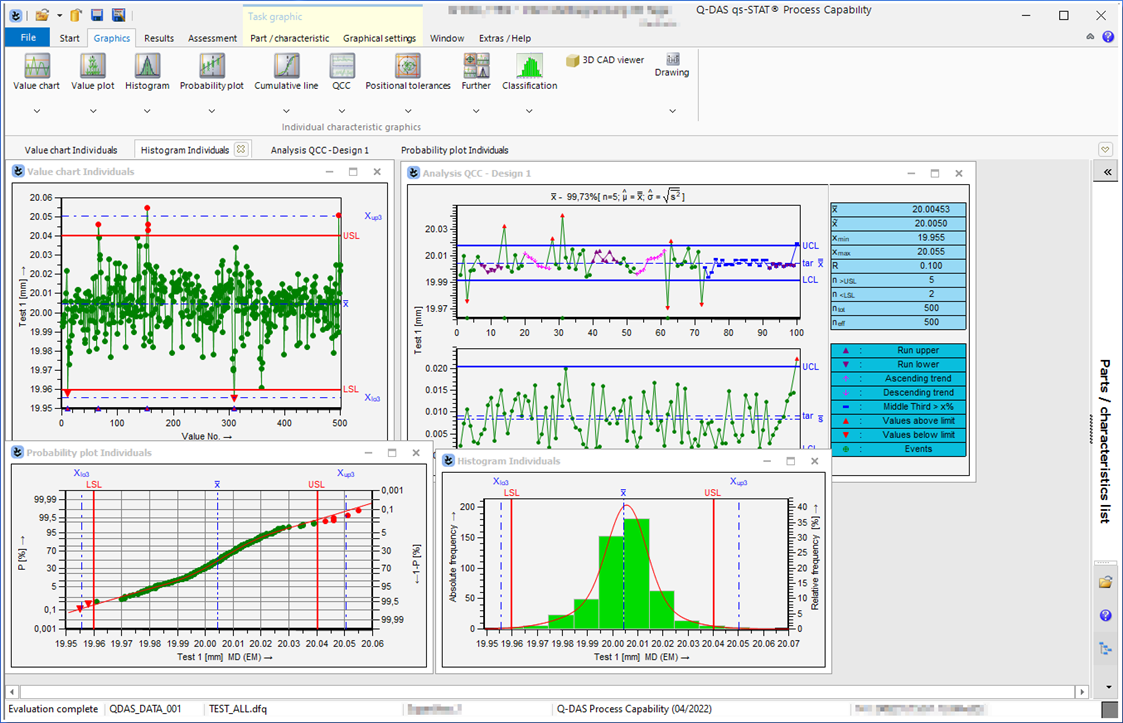
The "Individual Characteristic Graphics" group provides various graphics to display individual measured values for the currently selected characteristic.
 |
Link to: Value Chart |
 |
Link to: Value Plot |
 |
Link to: Histogram |
 |
Link to: Probability Plot |
 |
Link to: Cumulative Line |
 |
Link to: QCC |
 |
Link to: Positional Tolerances |
 |
Link to: Classification |
 |
Link to: Deviation from Target Value |
 |
Link to: Tolerance Utilisation |