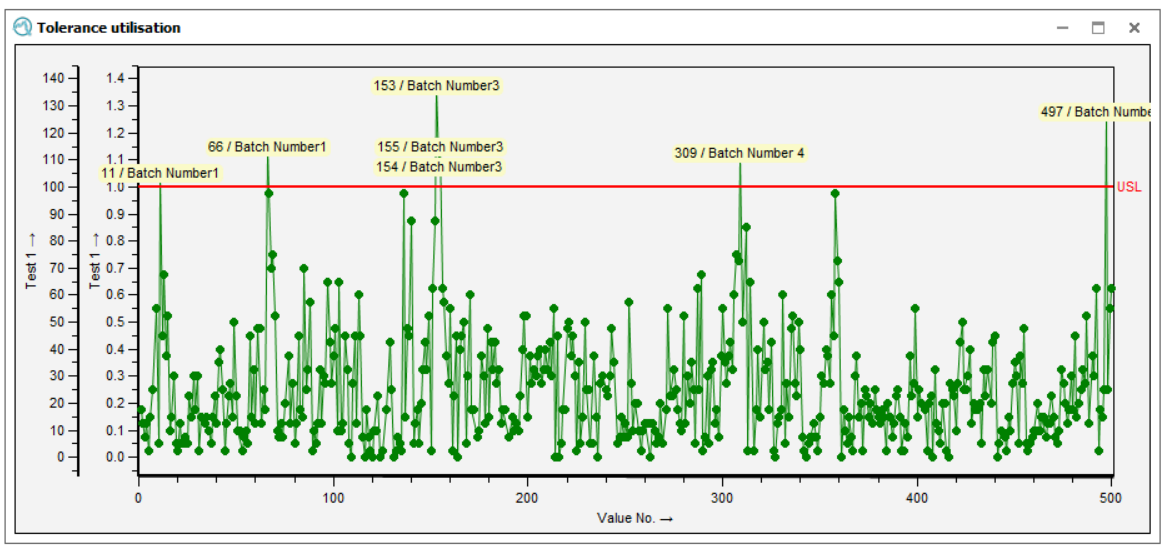
The tolerance utilisation graph shows the relative utilisation of the tolerance for each individual measured value, depending on the characteristic type.
| Tolerance Utilisation This document includes the tolerance utilisation per characteristic, the overview graphic "Tolerance utilisation characteristics" as well as the tolerance utilisation of the part evaluation. |
English: |
German: |
|
General configuration
Options for general graphics configuration are stored in the "Graphical settings" tab. Link to Q-DAS Graphics - General Configuration |
||
|
Working with the graphics
The "Part / characteristic" tab provides options and functions for working with graphics. These include various data selection options for display and evaluation, as well as various configuration options for the displaying multiple characteristics. Link to Working with the Q-DAS Graphics |
