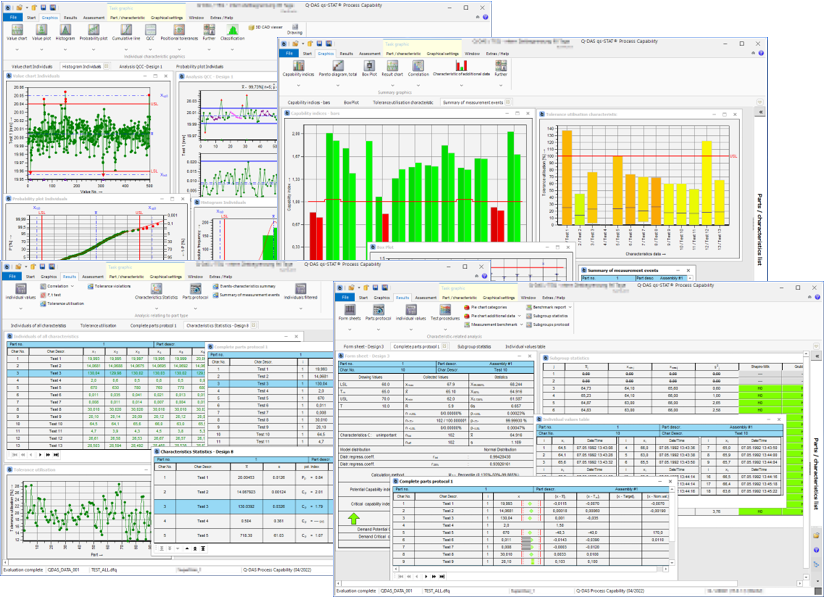
The Q-DAS applications provide various graphics to display evaluation results, individual measured values or several characteristics in one graphic. The graphics available in the ribbon bar are grouped according to their purpose. The collection of subtopics here is the description of each graphic, as well as general configuration and usage.

