There are several ways to define or limit the amount of data displayed in reports.
Table of Contents
Filtering using database queries
When working with databases, it is possible to save search conditions, the combination of advanced filters, in queries using the "Read from database" dialogues.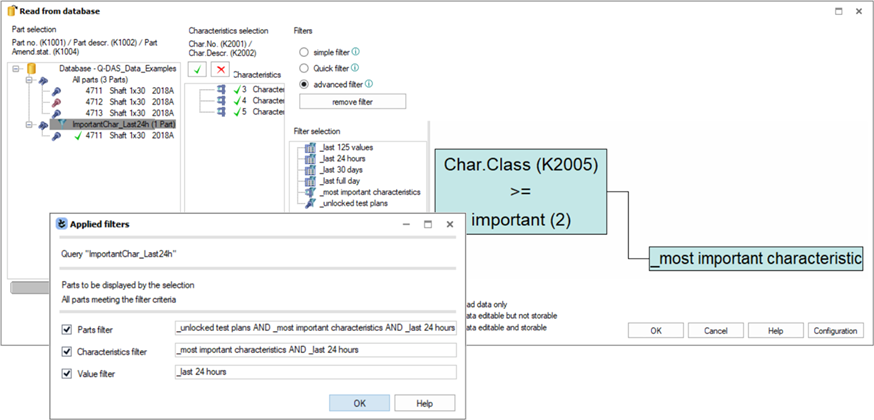
Using the "Form designer" (Q-FD), the queries can be assigned to a full report. But also to a report section.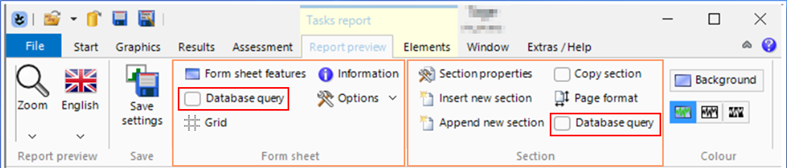
Here is an example of how to assign a query to a report. The report will then only show the filtered results of the query. 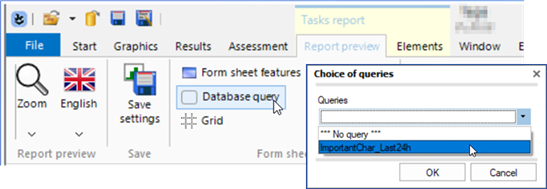
For example, if a report with data selection is opened in qs-STAT, the filtered results are loaded in "read data only" mode. This is indicated by the blue parts/characteristics list.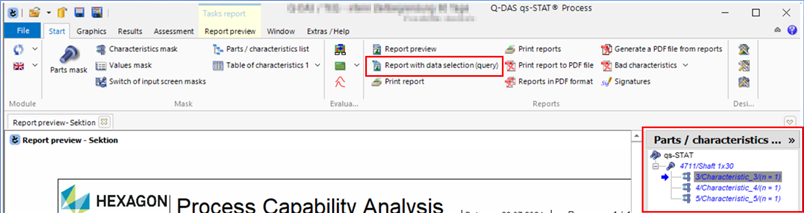
Filtering using “Selection/Sorting” dialogue
Another way to define or limit the amount of data is to use the “Selection/Sorting” dialogue. With this dialogue it is possible to restrict the data pool in a report section, in Q-DAS overview graphics or single output points in Q-DAS list graphics. 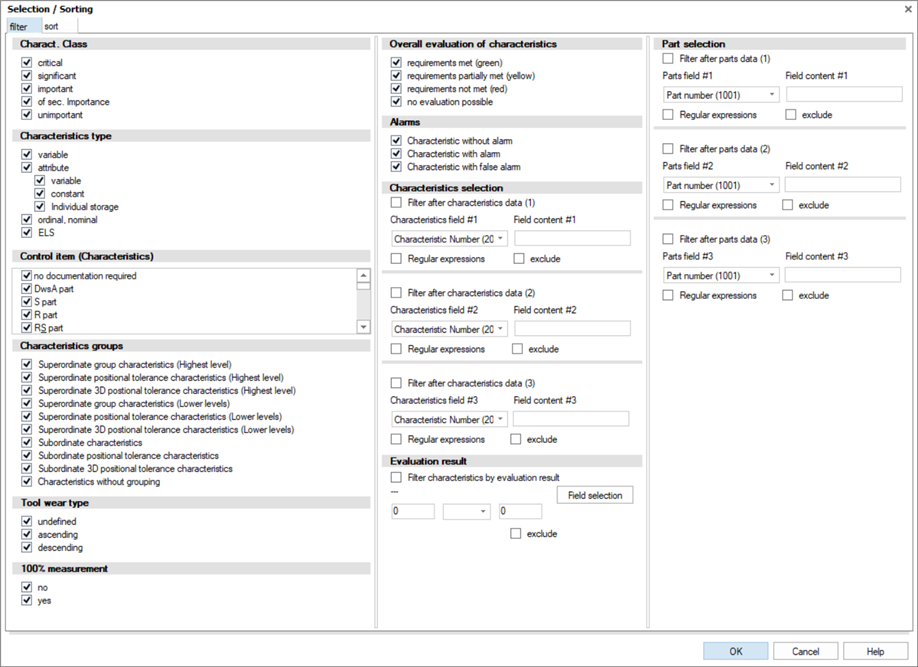
What types of filters are available?
The dialogue offers the possibility to filter the results (output points) and the K-fields at the part level and at the characteristic level.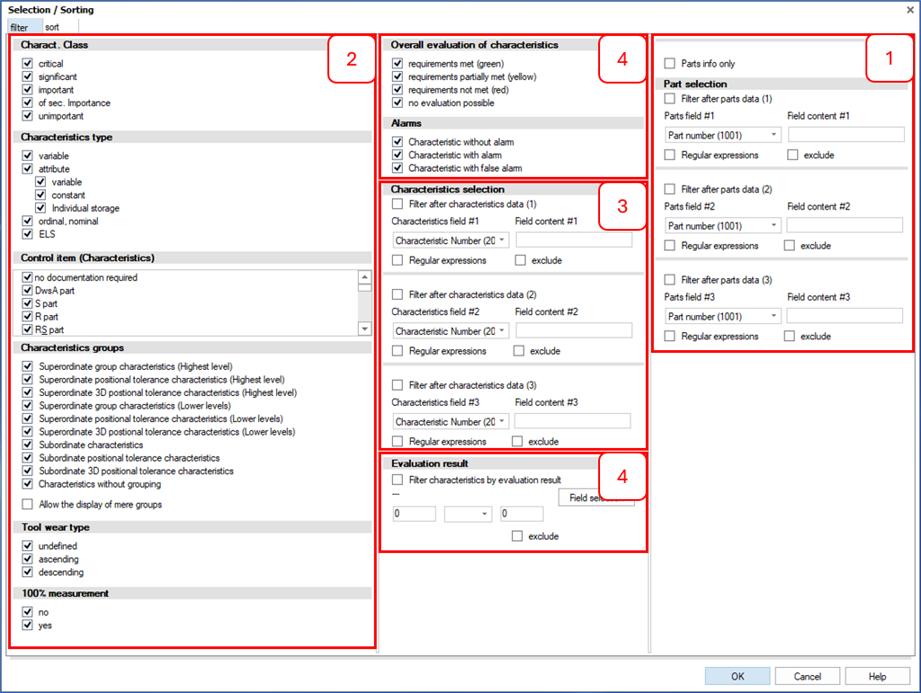
| 1 | Filter for K1xxx The part level K-field can be selected from the drop down list. The search term must be entered manually in the “Field content”. 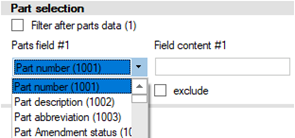 |
| 2/3 | Filter for K2xxx Some of the K-field contents are defined by the Q-DAS application, by the catalogue or by a special writing mode. Detailed information on the data format can be found in a separate topic. Link to: Data Format 2 - The filters for the characteristic K-fields with a defined content are activated by clicking on the corresponding content. In the following example, the filter shows only the characteristic with the characteristic class (Charact. Class, K2005) "important". 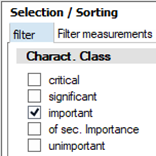 3 - The undefined characteristic K-fields can be selected from the drop down list. The search term must be entered manually in the "field content". 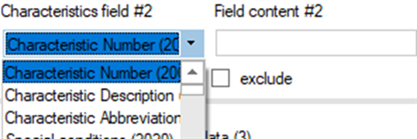 |
| 4 | Filter for Results There are two different ways to filter for result fields. Certain result fields can be activated by clicking on the corresponding content. And there is a field selection where a result field can be selected from the "Output field selection (listing)". |
How to access the "Selection/Sorting" dialogue
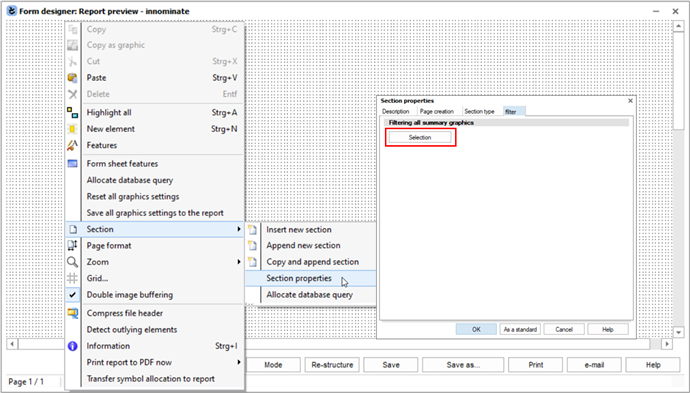
- Access to "Selection/Sorting" dialogue within a report section.
- In the Q-DAS graphics, the "Selection/Sorting" dialogue is accessed via the "filter/sort" icon.

The icon is available in the ribbon bar and the context menu when the graphic is highlighted in "Form designer" (Q-FD).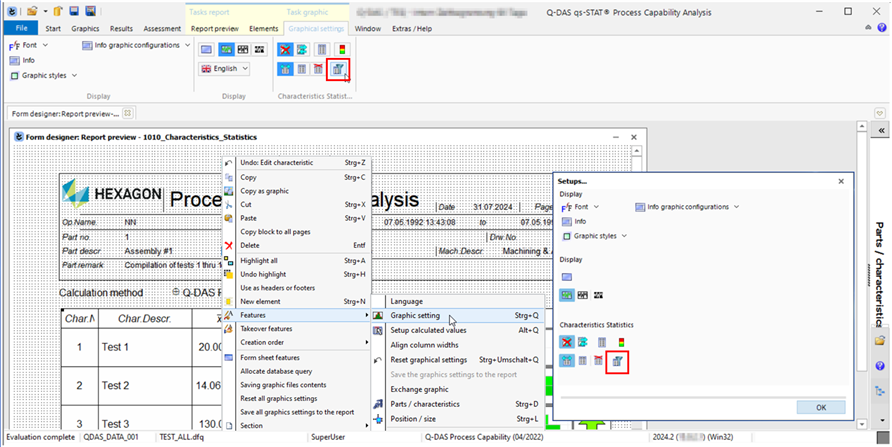
- In order to define or limit the amount of data for an output point, the relevant list graphics must be in "Edit mode". Only then is it possible to add or change an output point in a cell of the list graphic. How to use the edit mode and how to deal with output points is part of a separate description. Link to: Q-DAS Graphics - General Configuration

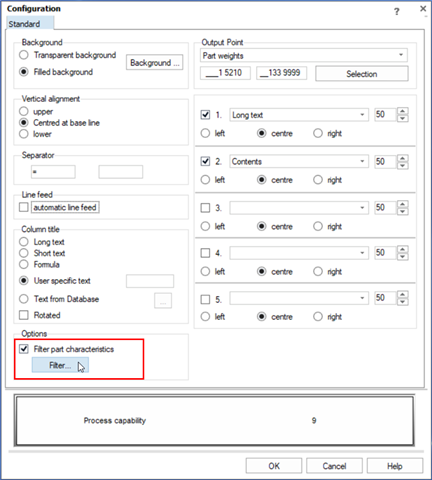
Important:
Not every output point has a filter / sort function.If the filter function is available for an output point, this is indicated by the available "Options". To access the "Selection/Sorting" dialogue, set the "Filter part characteristics" option and then click on the "Filter" button.