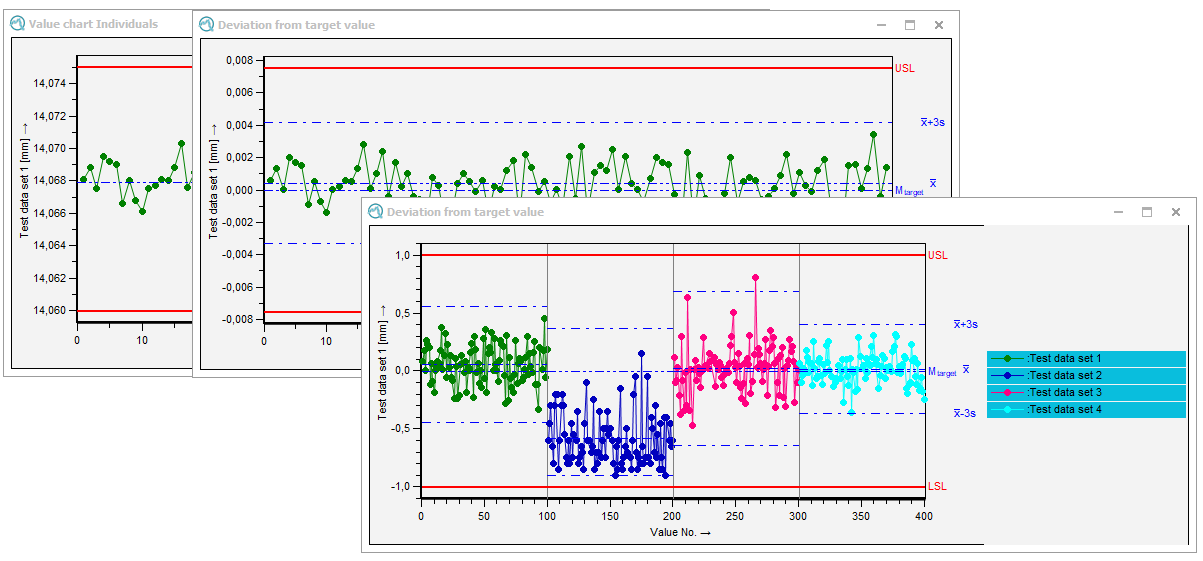
The "deviation from target value" chart is a subtype of the value chart which only shows the deviations from the target value (tolerance centre or entered target value). Due to the possibility of standardised representation, characteristics with different tolerance positions as well as tolerance widths can be compared.

| Deviation from Target Value This document describes the special settings that only apply to this graphic. |
English:PDF | German:PDF |
| Value Chart The general use of the "Value Chart" is described in a separate topic. Link to Value Chart |
||
|
General configuration
Options for general graphics configuration are stored in the "Graphical settings" tab. Link to Q-DAS Graphics - General Configuration |
||
|
Working with the graphics
The "Part / characteristic" tab provides options and functions for working with graphics. These include various data selection options for display and evaluation, as well as various configuration options for the displaying multiple characteristics. Link to Working with the Q-DAS Graphics |


