There is no tolerance for a one-sided specification limit. In this case, the VDA5 allows the tolerance to be replaced by a so-called reference figure RF. Two kinds of reference figures are available in our solara.MP software:
-
Reference figure "Manufacturing process (s and Cp)"
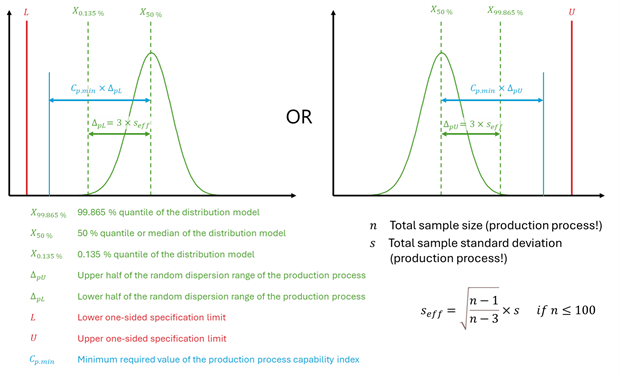
Figure 1: Calculation scheme of the reference figure - The horizontal blue line represents the calculated reference figure (Cp.min × Δp) In this case we assume normal distributed production process data and the user must provide in the "Master data" characteristics mask ...
- EITHER the upper limit OR the lower limit.
- The Reference Figure "Manufacturing process (s and Cp value)".
- The minimum required capability index Cp of the manufacturing process.
- The total sample size of the data which has been used to calculate the standard deviation (our next field marked as 'e').
- The calculated value of the standard deviation of the manufacturing process.
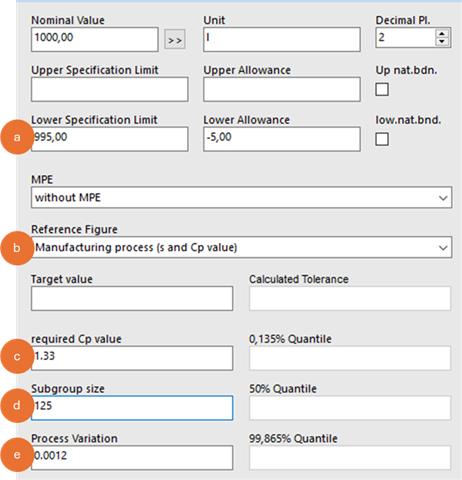
Figure 2: Detail of the characteristic mask (Master data) -
Reference Figure "Manufacturing process (quantiles and Cp value)"
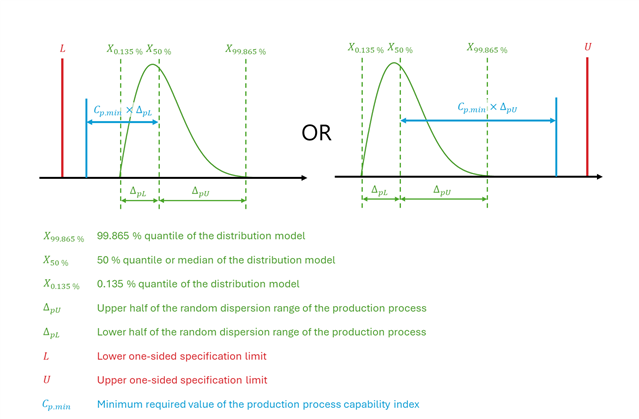
Figure 3: Calculation scheme of the reference figure - The horizontal blue line represents the calculated reference figure (Cp.min × Δp) In this case we assume not normal distributed production data and the user must provide in the "Master data" characteristics mask ...
- EITHER the upper limit OR the lower limit.
- Reference Figure "Manufacturing process (quantiles and Cp value)".
- The minimum required capability index Cp of the manufacturing process.
- The 50 % Quanile of the distribution model which has been fitted to the manufacturing process data.
- If the upper limit is given, then provide only the 99.865 % quantile of the distribution model which has been fitted to the manufacturing process data.
If the lower limit is given, then provide only the 0.135 % quantile of the distribution model which has been fitted to the manufacturing process data.
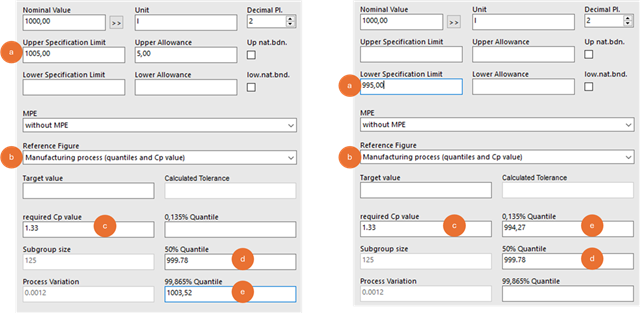
Figure 4: Two times a detail of the characteristics mask (Master data)