With changes in the VDA 5 we introduced some new functions in version 2024.2. One of the new functions is an output point that helps the users to identify what is wrong in the procedure or design of the study.
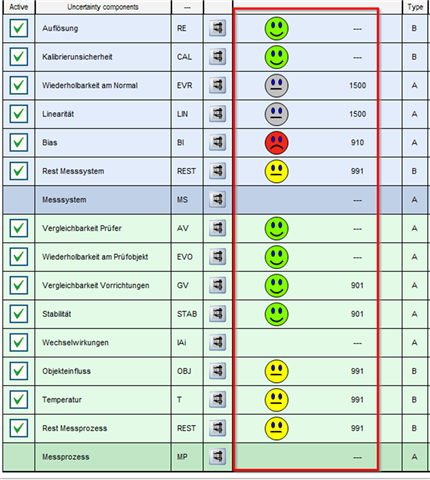
The Green, Yellow, Red and Grey smiley is not an indication about good or bad evaluation. It indicates where or not the procedure is done in a correct kind of way.
Here is the legend:
- Green – Everything is filled out correctly and in use
- Green with a specific code – Everything is filled out correctly but it is not in use.
- Yellow – Part of the budget is selected but no data are filled out. Therefore, user should either uncheck this or filled out the data that are needed.
- Red – The calculation is done, but only with part of the data. It waits for more data to be filled out. For example, when Bias is calculated from one standard, but it expects more standards based on selected settings (ANOVA).
- Grey – Mathematically impossible to calculate. For example, Linearity in the case where ANOVA was selected but only 1 standard is recorded.
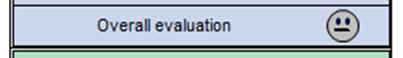
Be aware that also overall evaluation will not be given if there are problems in the design or procedure of the study.
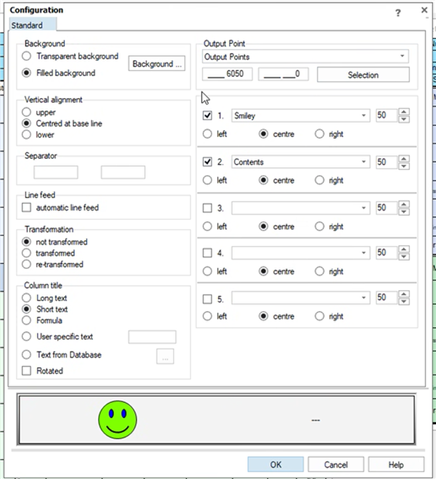
To activate the output point, the new column must be added to the budget table: