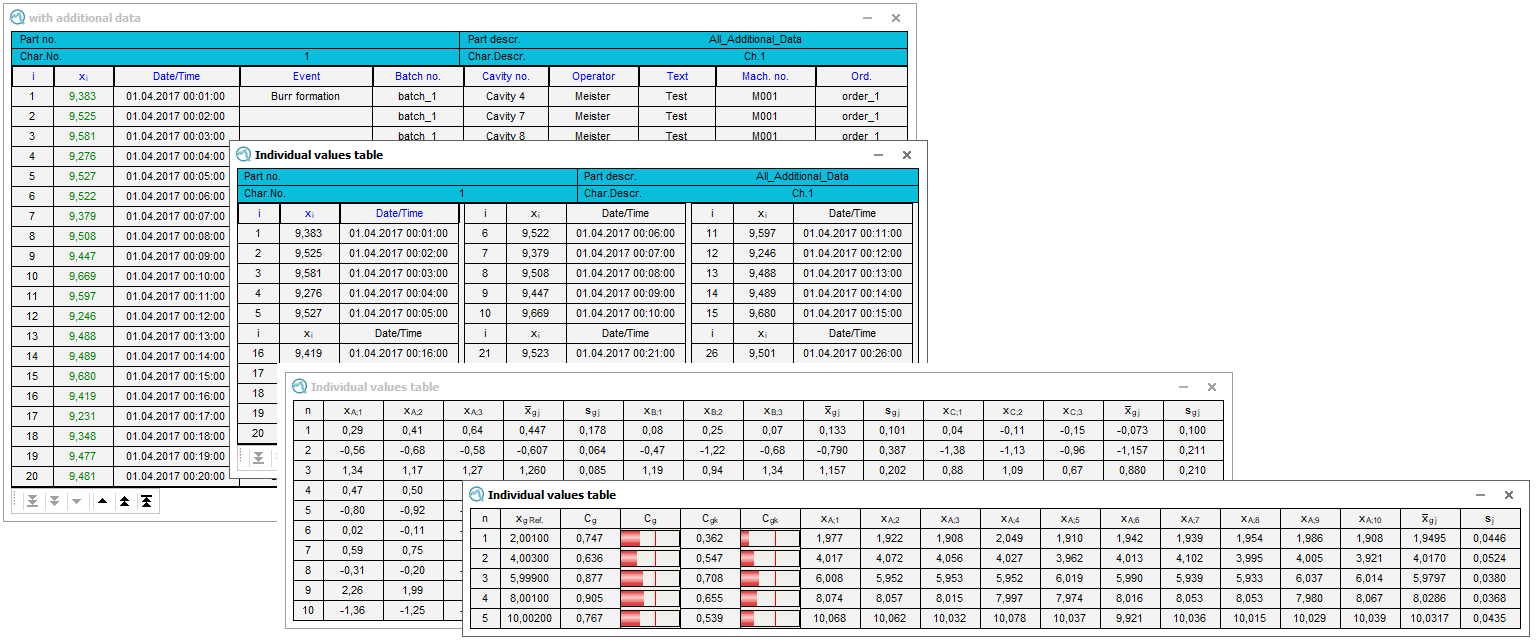
The graphical representation of the individual values per characteristic provides the ability to view the individual values of a characteristic in different ways. As a pure list with additional data, but also in natural sequence with representation of the individual subgroups. In solara.MP, the graphics are predefined for each evaluation type, for the representation of the individual values and the characteristic values of the operators/tests or, in the case of linearities, with the representation of the reference value and the "capabilities per reference". Especially in the solara.MP environment, the graphics per evaluation type have a special status.

| Individual Values This document describes the special settings that only apply to this graphic. |
English: |
German: |
|
General configuration
Options for general graphics configuration are stored in the "Graphical settings" tab. Link to Q-DAS Graphics - General Configuration |
||
|
Working with the graphics
The "Part / characteristic" tab provides options and functions for working with graphics. These include various data selection options for display and evaluation, as well as various configuration options for the displaying multiple characteristics. Link to Working with the Q-DAS Graphics |
