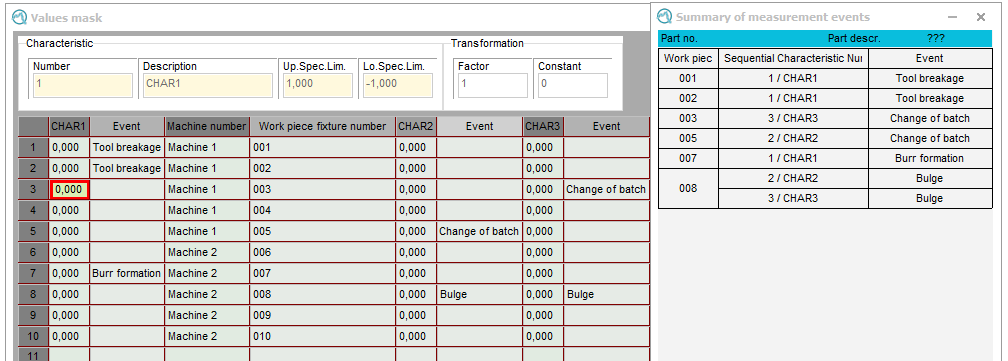
The graphic "Summary of measurement events" can be used to show an overview of which measurements (here in the picture as example K0017) had which events for which characteristics in a defined measurement context. The view is defined to have a unique measurement identification in an alphanumeric additional data field.

| Summary of Measurement Events This document describes the special settings that apply only to this graphic. |
English:PDF | German:PDF |
|
General configuration
Options for general graphics configuration are stored in the "Graphical settings" tab. Link to Q-DAS Graphics - General Configuration |
||
|
Working with the graphics
The "Part / characteristic" tab provides options and functions for working with graphics. These include various data selection options for display and evaluation, as well as various configuration options for the displaying multiple characteristics. Link to Working with the Q-DAS Graphics
|


